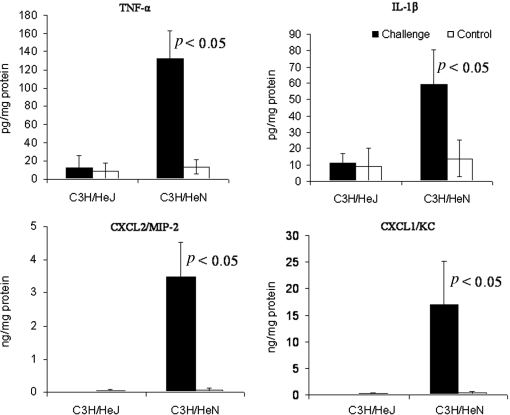
Figure 2.
Mammary cytokine and chemokine concentrations 24 h after intramammary infusion of 10 μg LPS in C3H/HeN and C3H/HeJ mice. Bars represent mean concentrations per mg total protein and S.E. of TNFα, IL-1β, MIP-2 (CXCL2) and KC (CXCL1) measured by ELISA in tissue homogenates of LPS and PBS-infused control glands of 6 mice in two different experiments. p < 0.05 value compared means between LPS and PBS-infused control glands using the Student t-test.

