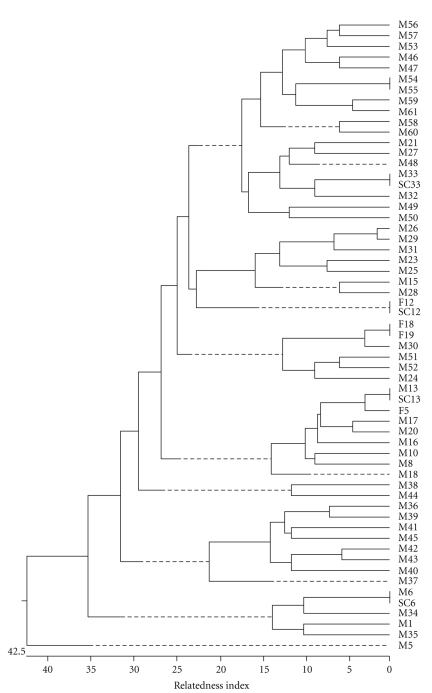
Figure 2.
Dendogram of the cluster analysis of the 60 consecutive gonococcal isolates obtained after opa-typing with HpaII. The relatedness values were calculated as the proportion of unweighted mismatches of fragments between the different patterns. The dendogram was generated by DNASTAR software package.

