
Figure 5.
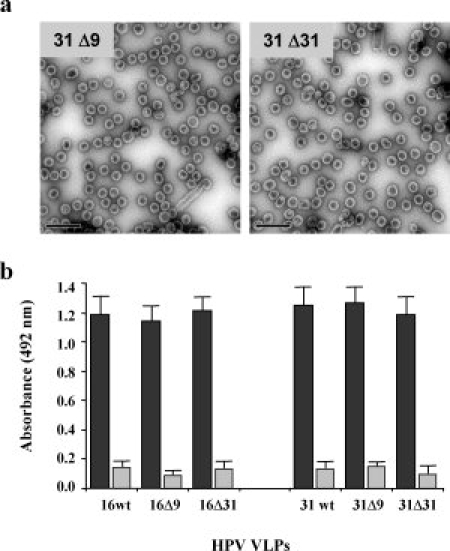
(a) HPV31Δ9 and HPV31Δ31 VLPs observed by transmission electron microscopy (Bars represent 200 nm). (b) Heparin binding of native VLPs (black columns) and denatured VLPs (grey columns) for type 16 and type 31 with or without C-terminal deletions (Δ9 and Δ31).