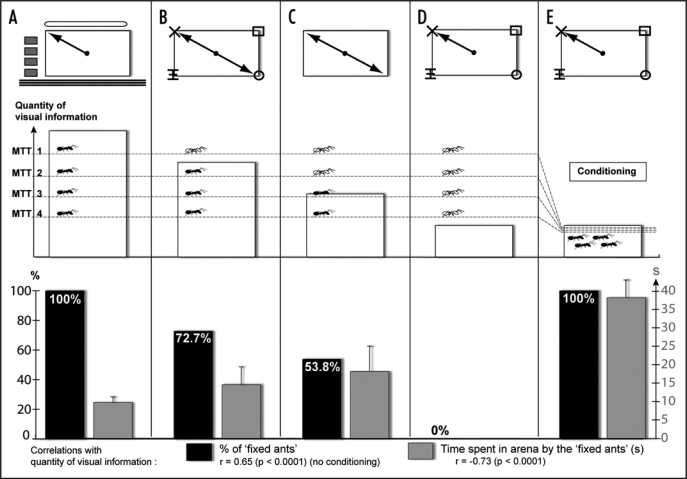
Figure 1.
This figure is divided horizontally in three different parts. The top part illustrates the different experimental conditions: (A) presence of conspicuous extra-arena cues; the ants systematically return to a preferred corner. (B) No extra-arena cues but black features (10 × 10 cm) emphasize the corners and the ants display a preference for two diagonally opposite corners. (C) Only the cue given by the shape of the rectangular arena is present and the ants display a preference for two diagonally opposite corners. (D and E) Same visual condition than in (B) but the ants use the subtle difference between the features to select a unique preferred corner. In (A–D) the four corners lead to the nest (spontaneous) whereas in (E), only one corner leads to the nest (conditioning). The middle part illustrates the concept of Mismatch Tolerance Threshold (MTT). The graph shows the assumed amount of visual information given by the global view in order to display the corner preferences illustrated in the top part. Four hypothetical MTTs are represented: depending on their MTT, the figured ants are black (fixed ants, display corner preferences) or white (random ants, display random corner choices). The bottom part presents the actual data. In black, the proportion of fixed ants (display the corner preference). In grey, the time spent by the fixed ants in the arena before reaching a corner. Both “time” and “% of fixed ants” are correlated to the amount of visual information (p < 0.0001).

