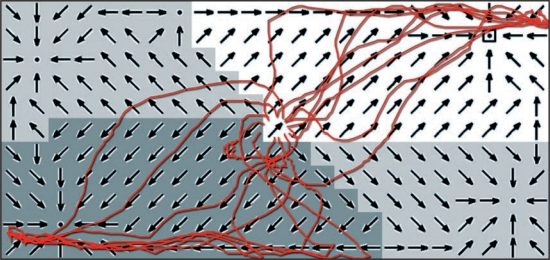
Figure 2.
The red lines represent 16 successive paths of a same ant released at the centre of a rectangular arena. The black arrows and grey areas illustrate a global matching model based on panoramic pictures (after Stürzl et al. model6 Fig. 2E). The model's reference picture is taken at one corner (black square) and a picture of each position in the arena is compared to the reference picture. Each arrow points to the neighbour that is the most similar to the reference picture. Catchment areas appear (grey and white areas). The ant's paths are matching the model's prediction remarkably well.

