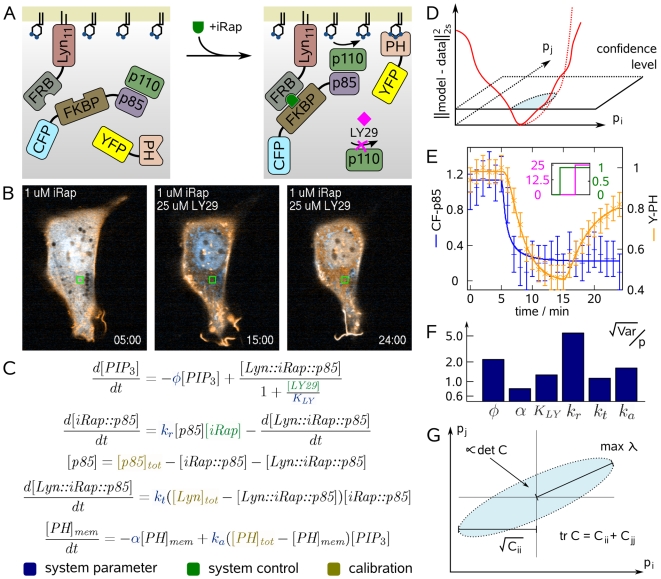
Figure 1. Parameter estimation of PI3K signaling reveals identifiability problems for important kinetic properties.
(A) iRap-induced dimerization of FKBP with FRB recruits CF-p85 to the plasma membrane and activates the catalytic subunit p110 of PI3K to produce  from
from  . PH domains of many downstream signaling proteins bind to
  enriched membranes with differential affinities. LY29 is a widely used inhibitor of PI3K. (B) Confocal fluorescence images of an NIH 3T3 cell (CF-p85 shown in cyan, Y-PH in yellow). Initially, CF-p85 and Y-PH reside in the cytosol (left). Addition of iRap recruits both constructs to the plasma membrane as can be judged from cytosolic depletion (middle). Y-PH but not CF-p85 dissociates from the plasma membrane upon addition of LY29. Experiment time is shown in minutes. (C) Differential equations model of the dynamic system illustrated in (A). System parameters are shown in blue, variables that allow control of the system are shown in green, and calibration parameters which were different from cell to cell are shown in gold. (D) Parameter values can be inferred by minimizing the discrepancy between model and experimental data. The schematic illustrates this concept for two parameters,
  and
and  . The range of possible parameter values is where this discrepancy falls below the confidence level (blue shaded ellipsoid). If this range is large, parameters can be inferred only with high uncertainty. (E) Fluorescence was quantified in the green square depicted in (B), and the model in (C) was fit to that data. Error bars show data, continuous lines show model output. Blue error bars and lines show cytosolic fluorescence of CF-p85, orange error bars and lines cytosolic fluorescence of Y-PH. (F) The relative uncertainty of parameter estimates was very high. This is a common problem in systems biology models. (G) Schematic projection of the confidence ellipsoid from (D). Good experiments minimize the size of this uncertainty region (shaded blue). Criteria that have been proposed for describing this size are the longest half-axis, the average extent, or the volume of the confidence ellipsoid, among others. These criteria correspond to properties of the parameter covariance matrix
  .
.

