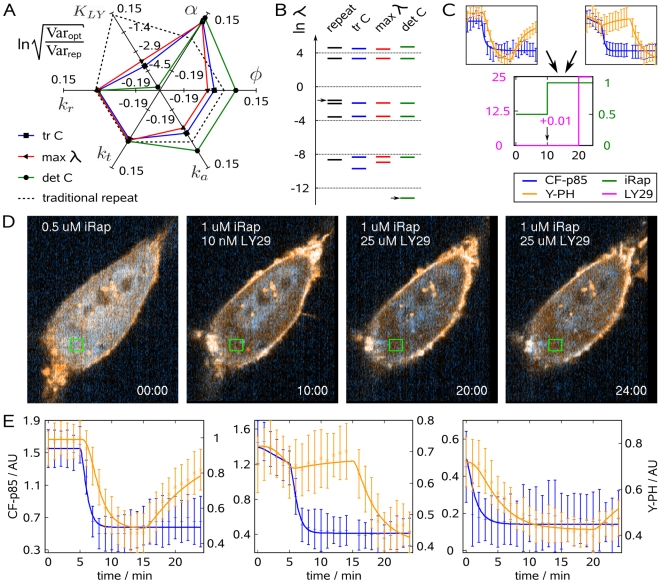
Figure 3. Minimization of different uncertainty criteria under experimentally meaningful design constraints.
Different uncertainty criteria were minimized by finding optimal time points for adding drugs and optimal concentrations. Washouts were excluded from the design space by a dynamic constraint formulation. (A) Performance comparison of different criteria with respect to parameter uncertainty or (B) the eigenvalue spectrum of the optimized experimental design. Arrows indicate the eigenvalue that is aligned with the uncertainty of  . (C) Schematic of sequential experimentation. The data from the traditional and the first optimized experiment were used for optimizing the concentration-time profile of iRap (green) and LY29 (pink) for the next experiment. (D) NIH 3T3 cell (CF-p85 shown in cyan, Y-PH in yellow).
  iRap was added at the beginning of the experiment. 10 min later, another 10 nM LY29 and another
  iRap were added. PI3K remained active as judged from low cytosolic fluorescence of Y-PH.
  LY29 was added at minute 20, resulting in dissociation of Y-PH from the plasma membrane. Time is shown in minutes. (E) Combined parameter estimation on all three experiments. Error bars show data, continuous lines show model output. Blue error bars and lines show cytosolic fluorescence of CF-p85, orange ones show cytosolic fluorescence of Y-PH.

