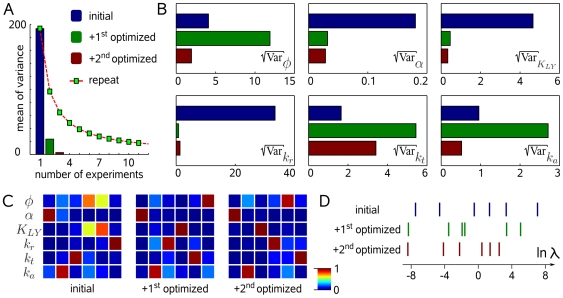
Figure 4. Decline of uncertainty.
(A) The mean of parameter variances dropped from 193.5 after the traditional experiment to 2.9 after the second optimized one. For comparison, parameter uncertainties were calculated for repetitions of the intuitive traditional experiment. (B) Parameter uncertainties after individual experiments were performed. (C) Normalized eigenvectors of the corresponding covariance matrices ordered in ascending length suggest that correlation between biological parameters was largely eliminated. (D) The ranges of the eigenvalue spectra of  were consistently reduced.

