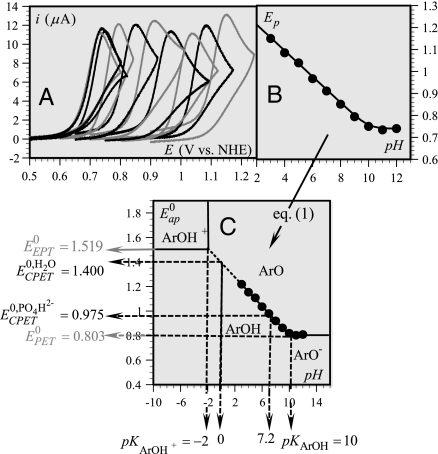
Fig. 1.
Determining the thermodynamics of phenol oxidation. (A) Cyclic voltammetry of 0.2 mM PhOH in 0.05-M Britton Robinson buffers at 0.2 V/s as a function of pH. pH values from right to left: 3, 4, 5, 6, 7, 8, 9, 10, 11, 12. (B) Peak potential (in V vs. NHE) as a function of pH at 0.2 V/s. (C) Variation of the apparent standard potential with pH (Pourbaix diagram), showing the zones of thermodynamic stability of the various species and the characteristic pKs and standard potentials. All potentials are referred to the NHE.

