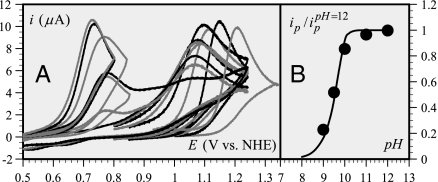
Fig. 2.
Oxidation of phenol in unbuffered water. (A) Cyclic voltammetry of 0.2 mM PhOH in unbuffered water at 0.2 V/s as a function of pH. pH values from right to left: 2, 3, 4, 5, 6, 7, 8, 8.5, 9, 9.5, 9.5, 10, 11, 12. (B) Basic unbuffered water (first five voltammograms of Fig. 2A) showing the decrease of the peak current with the pH (dots) as compared with the simulation (full line) (see parameter values in Table 1) of an OH−–PET pathway according to Eq. 2. The peak currents ip are normalized versus the value at pH = 12.

