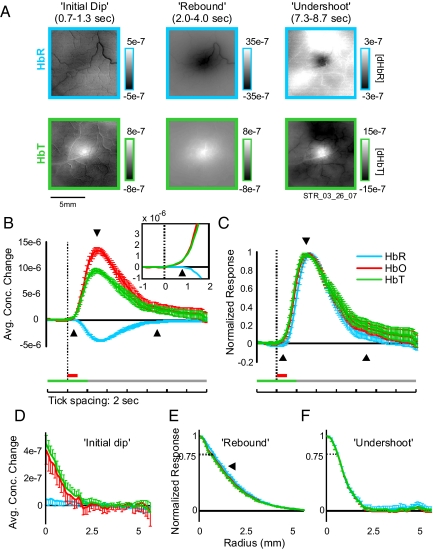
Fig. 3.
Spectral decomposition of imaging signal shows no increase in HbR during the initial dip period as defined for the oximetric signal. (A) Spectrally decomposed point spreads: same experiment as in Fig. 1B. Conventions are as in Figs. 1 and 2. Only the images for HbR and HbT are shown. (B) The average temporal profile of concentration changes at response center after visual stimulation. Spectral decomposition was done separately for each experiment and then averaged. Conventions are as in Fig. 2A. Note the lack of any detectable increase in HbR despite clear initial dip signals in Fig. 2. (Inset) Magnified view of concentration changes during early portion of response, 1–2 s after stimulus. Note the early increase in HbT and the lack of any increase (only a late decrease) in HbR. (C) Same as B, but normalized to maximal response (HbR signal is thus flipped in sign). Note HbR signal lagging behind HbT at onset but decaying faster toward baseline. (D–F) The radial profiles of concentration changes for HbR, HbO, and HbT during the three oximetric response phases (as in Fig. 2). (D) Concentration changes early into the initial dip (t = 0.8 s). Unnormalized because there was no reliable change in HbR at this time point (see A and B). Compare with Fig. 2D. (E) Same as D, but for the rebound phase and scaled to maximum (t = 3 s). Note HbR signal is slightly broader than HbT. (F) Same as E, but for the undershoot phase (t = 9 s). Note similar point spreads in all components.

