Fig. 5.
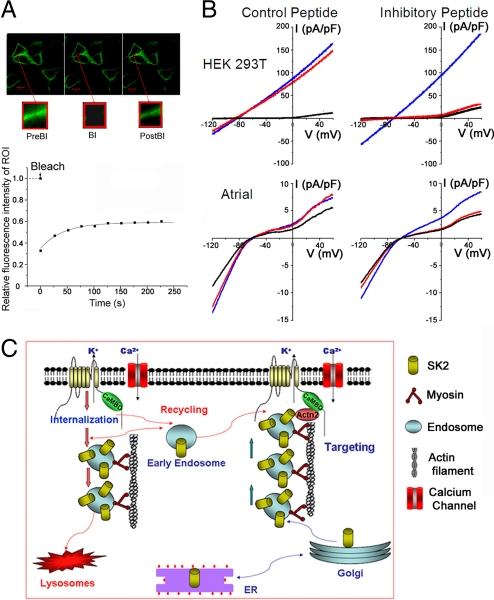
Dynamic regulation of SK2 channel cell-surface expression probed using live-cell imaging and patch-clamp recording with inhibitory peptide. (A) FRAP experiments were performed in HEK 293T cells transfected with CFP-SK2 and α-actinin2 plasmids. Insets: Sequential images of an ROI. PreBl, Prebleach; Bl, Bleach; PostBl, Postbleach. Bottom: Relative fluorescence intensity of the ROI pre- and postbleach. Time constant of recovery (τ) was 42.5 ± 4.3 s (n = 5). (B) Whole-cell IK,Ca was recorded immediately after establishment of whole-cell configuration (blue line), 20 min thereafter (red line), and after application of apamin (100 pM; black line). A voltage-ramp protocol was applied from −120 to +60 mV, with a slope of 360 mV/s from a holding potential of −55 mV. SK2-mediated whole-cell IK,Ca from HEK 293T cells cotransfected with pIRES2-EGFP-SK2 and pcDNA3-α-actinin2 plasmids (Top) and IK,Ca recorded from mouse atrial myocytes (Bottom), using control peptide and inhibitory peptide. (C) A working model for the anterograde and retrograde trafficking of SK2 channel. SK2 channels directly interact with α-actinin2 cytoskeletal proteins, which help to anchor the channels at the surface membrane and along the T-tubular structure in cardiac myocytes (pathway on the right). Absence of α-actinin2 may lead to an increase in the rate of internalization and/or decrease in the targeting of the early endosomes to the surface membrane (pathway on the left).

