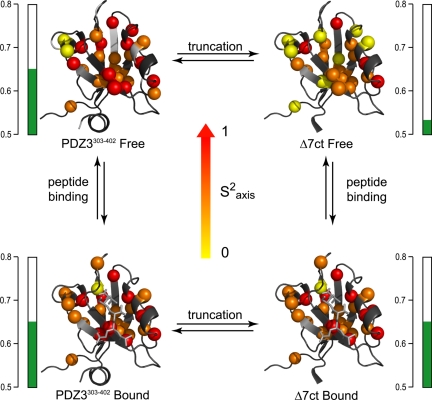
Fig. 5.
Methyl side-chain dynamics of PDZ3303–402 as a function of removal of α3 (left to right) and CRIPT peptide binding (top to bottom). Cα atoms of the corresponding methyl-bearing residues are color-coded according to S2axis parameters: yellow, 0 ≤ S2axis ≤ 0.4; orange, 0.4 < S2axis < 0.7; red, 0.7 ≤ S2axis ≤ 1. Average S2axis values for each state are indicated by green bars.

