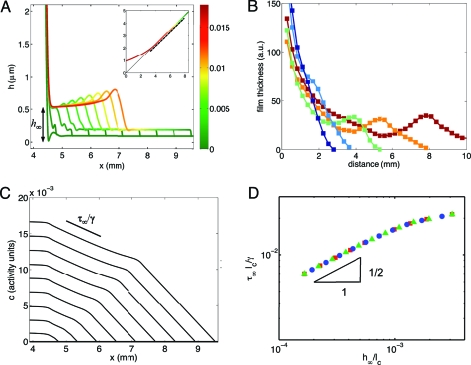
Fig. 3.
A model for surfactant production in the pellicle reproduces the dynamics of the spreading bacterial film. (A) Simulated film thickness profiles at 40 min intervals, from 0 (left-most, blue), to 6 hours (right-most, red) after onset of wall climbing. Color coding of interface gives the surfactant concentration. x = 0 is the equilibrium height of the flat interface. Note the different scalings of the film thickness and rise-height axes. The Inset shows the entire interface and spreading front, with the magnified region indicated by the dashed reference line. (B) Thickness profiles (arbitrary units) from the experimental measurements of the wall climbing film at times t = 900 min (dark blue), 940 min (light blue), 980 min (green), 1,020 min (orange), and 1,060 min (red) after innoculation. Note the presence of the capillary ridge at the edge of the film, in striking similarity to simulations in A. (C) Simulated surfactant concentrations show a pair of Marangoni waves, one with almost constant shear τ∞, advancing with the bacterial film, and the other advancing with the precursor film. (D) Film thickness and h ∞ and shear τ∞ satisfy a compatibility condition h ∞/ℓc = 3.57ℓc 2τ∞ 2/γ0 2 independently of the length scale h min: We show collapse for h min = 0.25 μm (red squares), 2 μm (green triangles), and 20 μm (blue circles).

