Fig. 3.
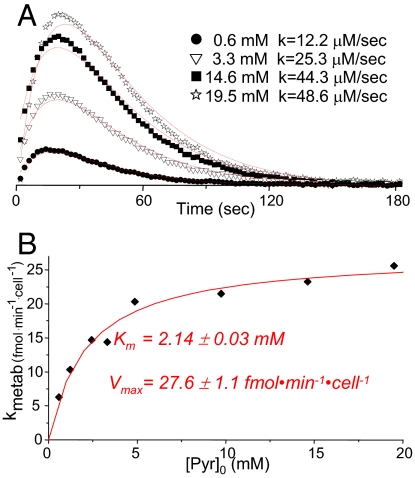
Normalized rates of pyruvate-to-lactate conversion, as revealed by hyperpolarized 13C NMR studies in T47D cells. (A) Lactate signal intensities observed after injection of various concentrations of hyperpolarized pyruvate to T47D human breast cancer cells. These intensities were normalized by the maximum intensity of their respective pyruvate signals, and divided by the assayed [Pyr]0 concentration for a meaningful visual comparison. Continuous red lines show the best fit to each dataset, leading to the indicated ks. (B) Plot of the rate per cell values vs. pyruvate concentration injected to the medium, showing in red the results of fitting this behavior to a Michaelis–Menten equation (R2 = 0.939).

