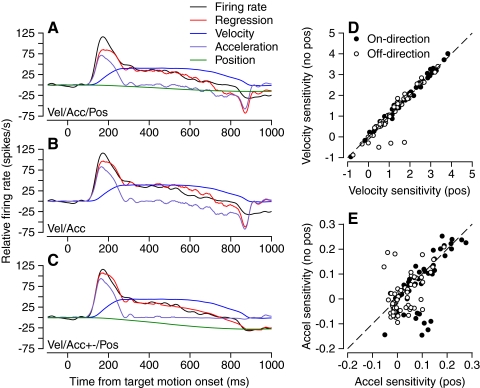
Fig. 2.
Linear regression analysis of the initiation of pursuit for a representative PC. In A–C, the black, red, purple, blue, and green traces show, respectively, the actual firing rate, the prediction of the linear regression model, the eye acceleration component [aË(t) or apË(t) + anËn(t)], the eye velocity component [bË(t)], and the eye position component [cE(t)]. Regression models are Eq. 2 in A, Eq. 1 in B, and Eq. 4 in C. D: scatterplot showing near identity of eye velocity regression coefficients based on regression with Eq. 3 on the y-axis vs. Eq. 4 on the x-axis. E: scatterplot showing similarity of positive eye acceleration regression coefficients based on regression with Eq. 3 on the y-axis vs. Eq. 4 on the x-axis. In D and E, filled and open symbols show data for on-direction and off-direction of pursuit.

