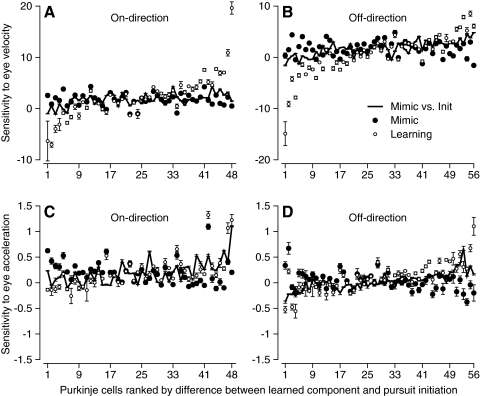
Fig. 9.
Statistical analysis of the difference between the eye velocity and acceleration sensitivities for the learned component of SS firing vs. the response during the initiation of pursuit along the mimic axis. A: eye velocity sensitivity in the on-direction. B: eye velocity sensitivity in the off-direction. C: eye acceleration sensitivity in the on-direction. D: eye acceleration sensitivity in the off-direction. Filled and open symbols summarize the regression analysis for the responses to step-ramp target motion along the mimic axis, and for the learned component of SS firing. Error bars indicate confidence intervals for the regression coefficients. Solid traces show the results of the same analysis for the responses to step-ramp target motion along the mimicry axis, compared with that along the preferred axis. Regression was performed using the firing rate from individual trials and the averages of eye movement across trials.

