Fig. 1.
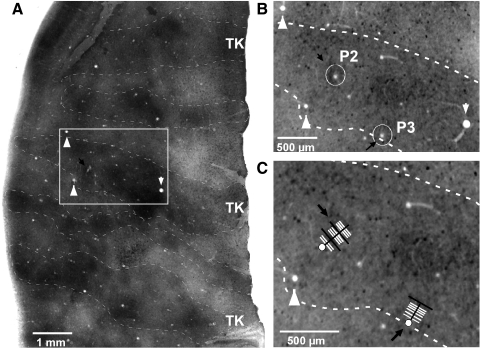
Example of 2 reconstructed electrode penetrations in secondary visual cortex (V2). A: low-power view of a portion of area V2 stained for cytochrome oxidase (CO), showing alternating thick (TK), pale, and thin CO stripes (dashed contours outline the dark CO stripes). The image is a composite of 4 CO sections that were aligned and merged using Adobe Photoshop. Two electrode penetrations are located inside the boxed area, which is shown at higher power in B. The black arrow points at one visible electrolytic lesion that was located along electrode penetration 2 (P2). Lesions placed along penetration 3 (P3) are not visible in this composite low-power image because they were either located in sections not used to make the composite CO image or because they were located in only one of the sections used for the composite image. White arrowheads in A point at the same blood vessel profiles as in B and C. B: higher-power view of a single CO-stained section inside the boxed region in A (used for the composite image in A) showing 2 lesions (circled and marked by black arrows), one along P2, the other along P3. C: higher-power view of the same section as in B showing the location of the 2 electrode penetrations (black arrows). White segments indicate the location of recorded cells. Black segments indicate locations of lesions and recorded cells (2 along P2 and one along P3). White dots indicate locations of lesions only (no cells recorded). Notice that all recorded cells in P2 and P3 were located in a thick CO stripe.

