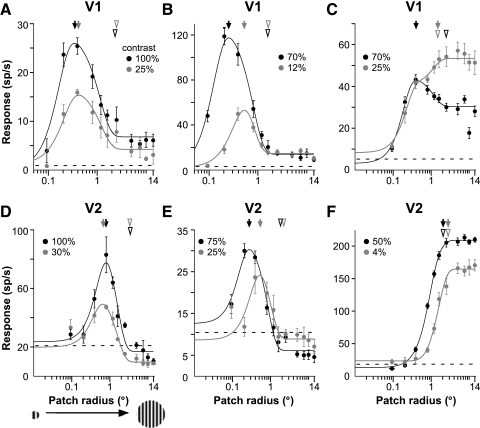
Fig. 2.
Patch-size tuning curves for 3 example V1 cells and 3 example V2 cells. Responses (mean firing rate) of 3 V1 cells (A–C) and 3 V2 cells (D and E) as a function of the radius of a circular optimal grating patch (stimulus shown in D). Black and gray curves: responses to a high- or low-contrast stimulus, respectively (contrast values used are indicated in each panel). Solid lines represent fits to the data (dots) using the difference of Gaussians (DOGs) model (see methods). Dashed lines indicate the cell's mean spontaneous firing rate. Arrows: radius of the high- or low-contrast stimulus evoking the largest response from a cell, respectively, sRFhigh (black) and sRFlow (gray): 0.35 and 0.42° (A), 0.26 and 0.54° (B), 0.42 and 1.44° (C), 0.8 and 0.65° (D), 0.28 and 0.53° (E), 2.02 and 2.73° (F). Open arrowheads: surround sizes, i.e., stimulus radius at asymptotic response, measured at high (black) and low (gray) stimulus contrast: 2.03 and 2.18° (A), 1.41 and 1.41° (B), 2.1 and 1.44° (C), 2.89 and 2.83° (D), 1.53 and 1.87° (E), 2.02 and 2.73° (F). Error bars represent SE values. The suppression index (SI) at high stimulus contrast for each cell was: 0.7 (A), 0.84 (B), 0.28 (C), 0.74 (D), 0.76 (E), 0 (F).

