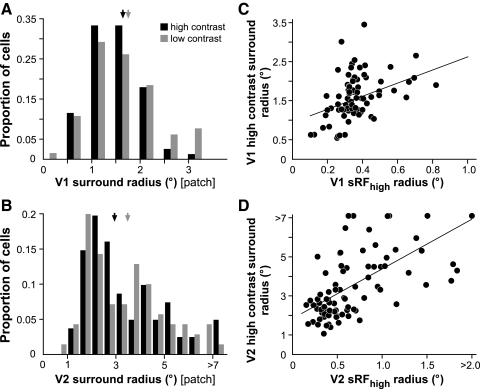
Fig. 5.
Surround sizes in V1 and V2 measured with expanding patch method. A and B: distribution of surround radii (asymptotic response radii) measured at high (black bars) and low (gray bars) stimulus contrast for the V1 (A) and V2 (B) cell samples. Black and gray arrows indicate median values at high and low contrast, respectively; see Table 1 for values. C and D: scatterplots of the sRFhigh radius vs. the surround radius measured at high contrast for the V1 and V2 cell samples, respectively. Black lines: regression lines. Note that the x-axes in B and D are exactly twice those in A and C, respectively.

