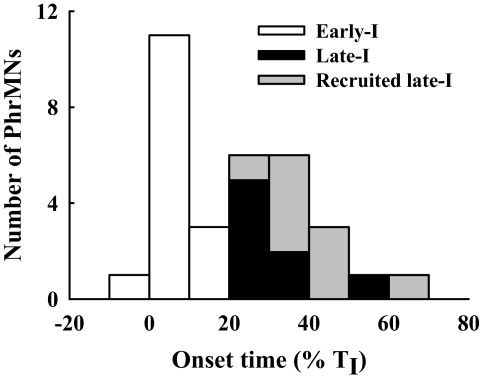
Fig. 5.
Distribution of PhrMN discharge onset. PhrMN discharge onset time was expressed as percentage of TI as measured from the contralateral phrenic neurogram. Early-I (white) and Late-I PhrMNs (black) were active during baseline conditions. The recruited late-I PhrMNs (gray) began bursting during hypoxia.

