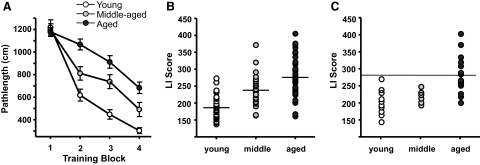
Fig. 1.
Behavioral testing and assessment of cognitive status of individual F344 rats. Rats were trained in the hidden platform version of the Morris water maze and tested by probe trials as described in methods. A: learning curves of all rats. The graph shows mean cumulative pathlength during each of the successive training trials for young, middle-aged, and aged rats. B: scatterplot shows the Learning Index (LI) score distribution of individual subjects within the 3 age groups for all of the rats in the sample used for electrophysiology experiments. Horizontal lines indicate the mean for each age group. LI scores were calculated as described in methods. C: scatterplot of LIs of rats in the calcium buffering experiments. The horizontal line at the LI score of 280 indicates the cutoff between rats considered cognitively impaired and those considered unimpaired and represents a score that is outside the range of the young animals. Subjects earning an LI score >280 were considered cognitively impaired. The learning curves and mean LI scores of each age group were significantly different from one another, as described in the text.

