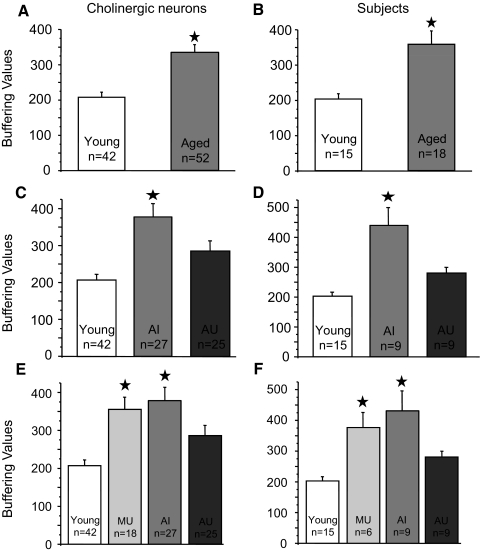
Fig. 5.
Ca2+ buffering values of cholinergic BF neurons in behaviorally characterized F344 rats during aging. Summary data showing the mean buffering values of all young and aged ChAT+ neurons (A) and the mean buffering values of ChAT+ neurons averaged for each young and aged subject (B). The mean buffering values of cholinergic neurons with the aged subjects divided into impaired and unimpaired cognitive status groups are shown in C, whereas the buffering values averaged within each subject are shown in D. Summary graphs incorporating the mean buffering values of ChAT+ neurons (E) and subjects (F) from middle-aged unimpaired rats are also shown. Note that β values for middle-aged unimpaired neurons and subjects are similar to those of the aged-impaired group. Stars indicate a significant difference (P < 0.05) from starless means. Error bars represent SE and statistical comparisons were by ANOVA for multiple comparisons.

