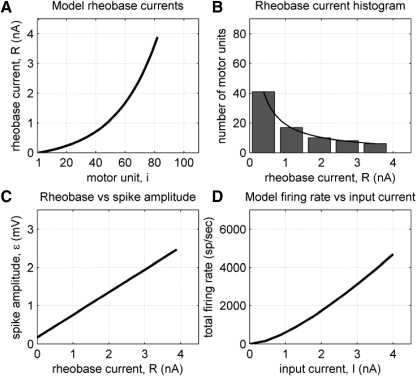
Fig. 3.
Properties of the model of the motoneuron pool with parameters derived from the RB1 data set (details in methods). A: exponential relation (Eq. 12) between motoneuron threshold (rheobase current) and the index i of the motor unit, numbered from 1 (smallest threshold) to 100 (largest threshold). For the RB1 data set the largest input current was 4 nA, so that neurons with a rheobase higher than this value were not recruited. B: distribution of motor units with respect to rheobase current, derived from the relation shown in A. The histogram indicates the number of units in each of 5 equal bins over the range of rheobase currents 0–4 nA. The exponential relation in Eq. 12 gives a hyperbolic distribution of motor unit numbers (best-fit hyperbola for a histogram with 5 intervals y = 41/[1 + 1.86(R − 0.4)] shown as black curve on plot), as expected theoretically by integrating Eq. 12 over motor unit number. C: linear relation between rheobase current and EMG spike amplitude. The x-intercept of this linear relation is the minimum threshold θ0 = 0.17 mV for EMG spike detection in data set RB1. D: relation between common drive input current and total motoneuron firing rate from model Eqs. 11 and 12. Note the weak deviation from linearity for small input currents.

