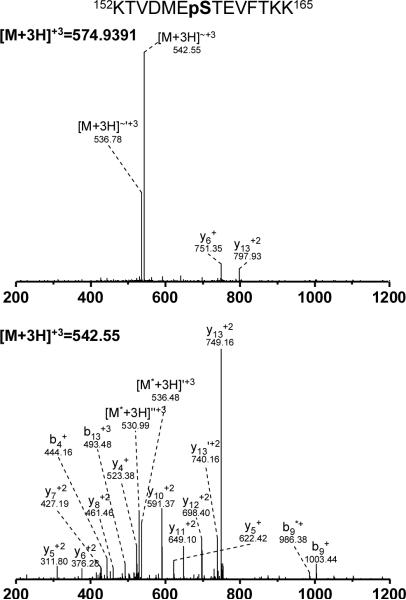
Figure 3.
Identification of a phosphorylation site on α-Casein-S2 by hierarchical MS2/MS3 database search. The figure demonstrates the capability of hierarchical search to localize the phosphorylation on a phosphopeptide containing multiple possible phosphorylation sites. The MS2 (top) and MS3 (bottom) spectra are shown to highlight the effect of neutral loss on the MS2 spectra. The detected phosphorylation site was previously reported by Kweon and Hakansson [10]. Neutral losses in the figure are labeled as follows: ~ (loss of phosphate moiety),* (loss of ammonia), ' (loss of water).

