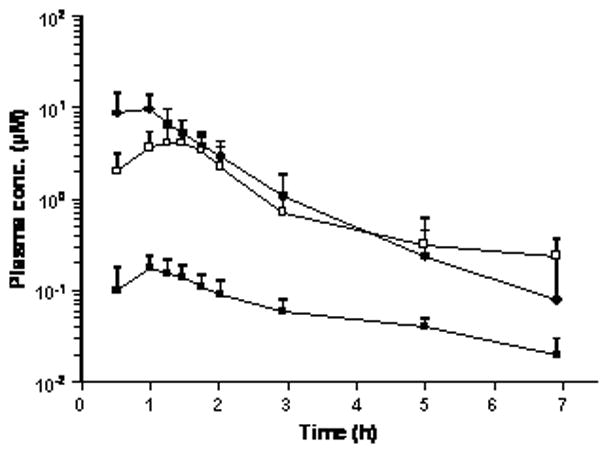
Figure 1.

Mean plasma concentration-time profiles of SU5416 (●) and its two major metabolites, SU9838 (■) and SU6595 (□), for the initial weekly dose of 110 mg/m2 SU5416 in the group of 13 patients who were not taking enzyme inducing anticonvulsant drugs. Error bars depict the SD of the mean concentrations.
