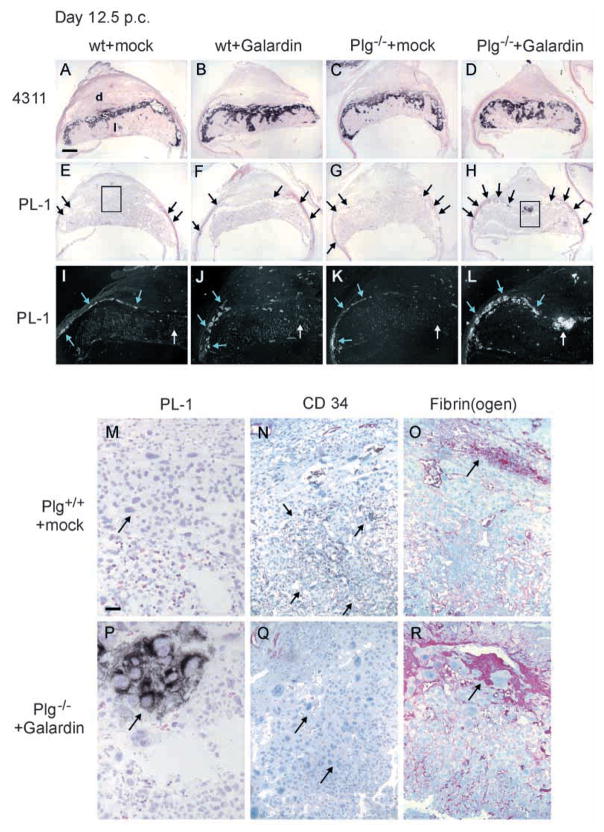
Fig. 4.
Effect of galardin treatment on 12.5 dpc placentas from wild-type and galardin-treated Plg-deficient mice. No difference in the distribution of the spongiotrophoblast cells identified by 4311 expression is observed between placentas from galardin-treated Plg-deficient mice (D) and placentas from mock- or galardin-treated wild-type mice or mock-treated Plg-deficient mice (A–C). Trophoblast giant cells were identified by in situ hybridization for PL-1 mRNA (brightfield, E–H,M,P; darkfield, I–L). The spatial distributions of PL1-positive cells in the central part of the placenta are shown in higher magnification of the boxed area of placentas from galardin-treated Plg-deficient mice (H,P), or from mock-treated wild-type mice (E,M). In mock-treated wild-type mice (E,I,M), galardin-treated wild-type mice (F,J) and mock-treated Plg-deficient mice (G,K) PL-1 positive trophoblast giant cells are primarily found towards the periphery of the placenta, whereas in galardin-treated Plg-deficient mice (H,L,Q) PL1-positive trophoblast giant cells are also found in the central part of the placenta (black and blue arrows). In I–L, white arrows point towards the central part of the placenta. Immunohistochemical staining for the endothelial cell marker CD34 (black arrows) (N,Q) revealed that the labyrinth layer in 33% of the placentas from galardin-treated Plg-deficient mice was non-vascularized (Q). Immunohistochemical staining for fibrin(ogen) in placentas from mock-treated wild-type mice (O) or from galardin-treated Plg-deficient mice (R) showed large amounts of fibrin deposition surrounding the central arteries in the middle of the placentas (black arrows). No other differences in the amount of fibrin deposition were observed in placentas from galardin-treated Plg-deficient mice, when compared with placentas from the other three groups of mice (O; data not shown).The areas boxed in E and H are shown at higher magnification in M–O and P–R respectively to demonstrate the distribution of the three different markers. D, decidua; L, labyrinth layer; S, spongiotrophoblast layer. Scale bar: 500 μm in A–H; 100 μm in I–N.

