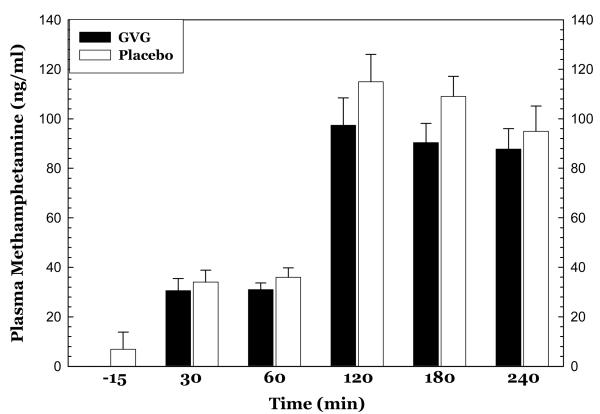
Figure 6.
Plasma levels of methamphetamine before and following two consecutive infusions of methamphetamine (15 mg + 30 mg, i.v.) as a function of drug (GVG or placebo) and time. Data represent the mean ± S.E.M. from only a subset (N=3 for GVG and N=4 for placebo) of methamphetamine-dependent participants on day 10.

