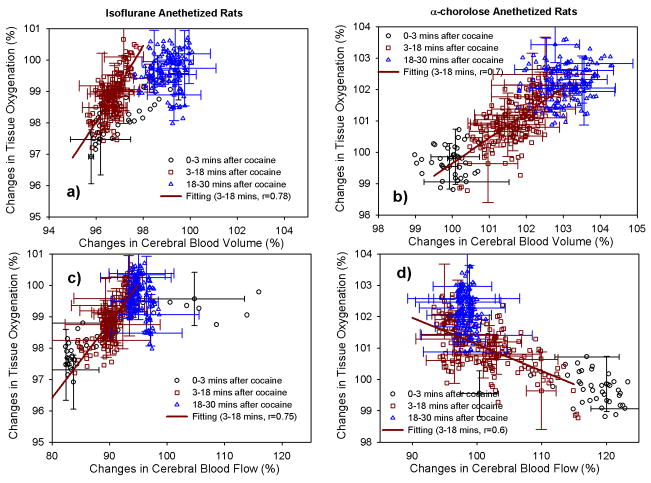
Fig. 5.
Changes of tissue oxygenation (StO2) as a function of changes in cerebral blood volume CBV (a, b) and blood flow CBF (c, d) following the cocaine administration within the cortical brains of the rats anesthetized by using ISO or α-CHLOR. The cross-correlation was analyzed using a linear fitting for StO2 versus CBV, StO2 versus CBF during the typical period of the cocaine binding into the brain (i.e., t= t1+t2 = 0–18 mins; t ≤ t(PK1/2max)). r represents the correlation coefficient of the linear fitting.

