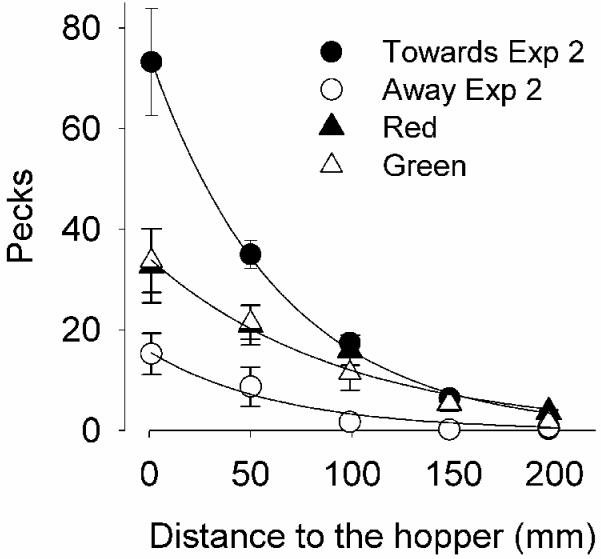
Figure 5.
Mean number of pecks in the Filter 40 loci from the last 5 sessions of Experiments 2 (circles) and 3 (triangles). Closed/open circles are response rates on stimuli moving towards/away from the hopper. Filled triangles denote red CS and open triangles green CS. The continuous curves are traces of the Motion-Dependent Single-Decay model, described in the text.

