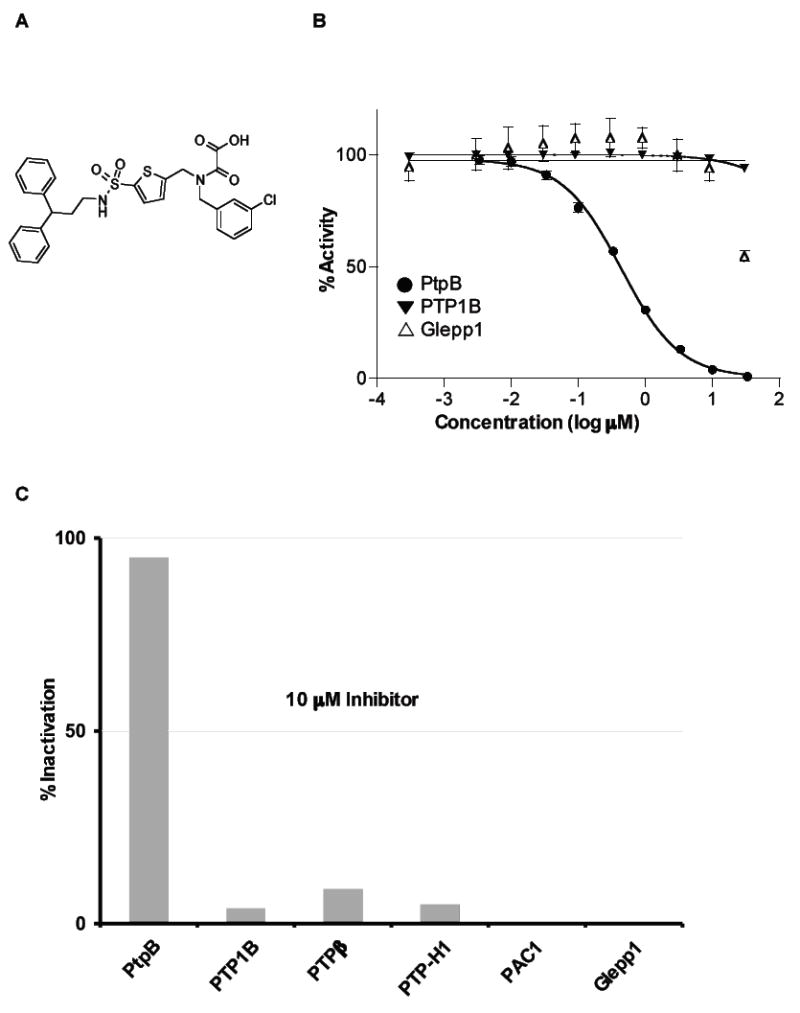
Figure 1. Inhibitory activity of OMTS on phosphatases.

(A) Structure of OMTS.
(B) IC50 determination. Inhibitory activity of increasing concentrations of OMTS was assessed on PtpB, Glepp1 and PTP1B phosphatases. Mean values and standard deviations are represented. An IC50 value for PtpB of 0.44 μM was calculated from this experiment.
(C) Selectivity of OMTS on a panel of phosphatases. Results are expressed as percent inhibition at 10 μM OMTS.
