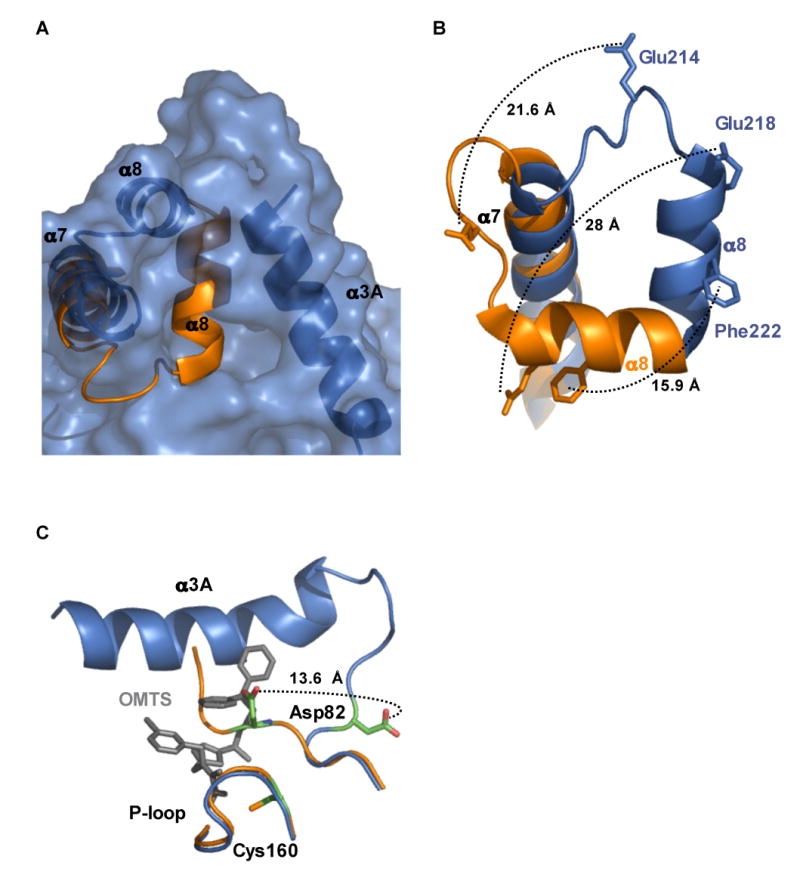
Figure 5. Movement of helix α8 allows access to the active site.

(A) Surface representation of the PtpB:OMTS structure (blue) shows the opening to the active site and the position of helix α3A that blocks access to the active site in the PtpB:PO4 structure (orange).
(B) Movement of selected residues in helix α8 upon inhibitor binding. Many residues buried in the PtpB:PO4 complex are exposed upon OMTS binding. Phe222, which mimics the substrate pTyr side chain in the autoinhibited PtpB:PO4 complex, shifts almost 16 Å. Glu218, which forms a salt bridge with the conserved, PO4-liganding Arg166 in the P-loop, moves almost 28 Å in the PtpB:OMTS complex.
(C) Helix α3A folds and the WPD loop flips upon inhibitor binding. The general acid Asp82 moves by >13 Å in the PtpB:OMTS complex (blue) compared to the product complex (orange). The new helix α3A (blue) and the proximal inhibitor (grey) clash with the WPD loop of the closed structure (orange).
