
Figure 2.
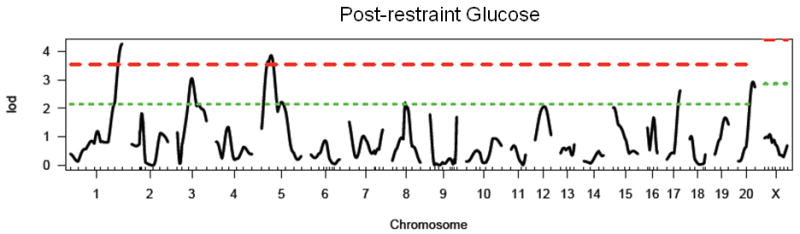
LOD plot for genome scan for log(post-restraint glucose). Chromosome location is on the x-axis and LOD score is on the y-axis. Top dashed line indicates highly significant threshold (95%) and bottom dashed line indicates suggestive threshold (37%).