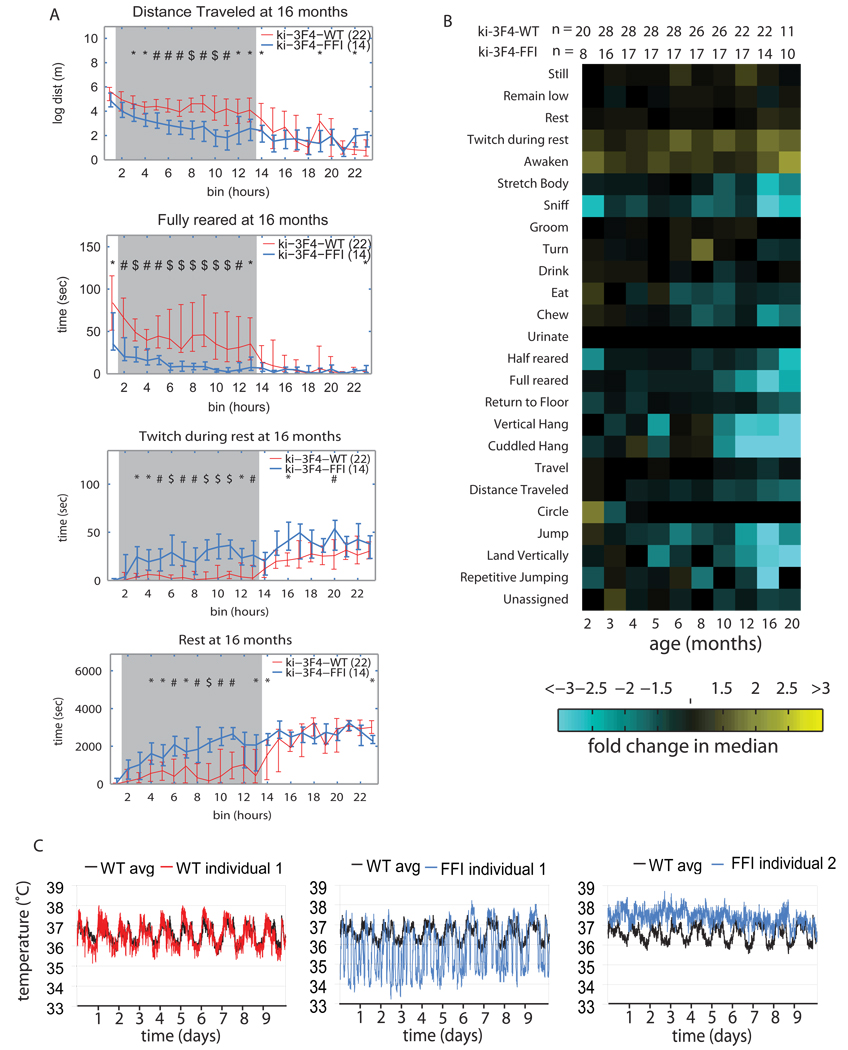
Figure 3. Behavioral abnormalities in ki-3F4-FFI mice.
(A) AMBA data of ki-3F4-FFI mice (blue lines) compared to ki-3F4-WT mice (red lines) at 16 months of age, show night time specific difference for distance traveled (top), fully reared (2nd from top), twitch at rest (3rd from top) and rest (bottom). Horizontal axes mark 24 one hour bins. The grey shading indicates the time at which lights are off (bins 2–13). P values are symbolized by * = p<0.05, # = p<0.01, $ = p<0.001. Vertical error bars depict quartiles, and connecting lines intersect at the median.
(B) A phenotypic array representing median differences between ki-3F4-WT and ki-3F4-FFI mice for specific behaviors, labeled on the left. Yellow tiles depict comparisons for which the ki-3F4-FFI mice performed the specific activity more than ki-3F4-WT, and cyan tiles represent comparisons where the ki-3F4-FFI mice performed the specific activity less than ki-3F4-WT mice. The brightness corresponds to the magnitude of the difference (a scale is below the arrays). The age in months is labeled directly below the array. The number of animals for each comparison is immediately above the array where “n1” rows indicate the number of ki-3F4-WT mice and “n2” rows indicate the number of ki-3F4-FFI mice.
(C) Body temperatures (Tb) were measured in 5 ki-3F4-WT and 5 ki-3F4-FFI mice at an accuracy of 0.067°C, using an implanted recorder. The Tb of a ki-3F4-WT (left WT individual 1, red) is plotted over the average Tb of 5 ki-3f4-WT mice (left, WT avg, black). Two ki-3F4-FFI mice (middle and left, FFI individual 1 and 2 respectively) are depicted by blue traces and are plotted over the same WT avg line. FFI mouse 1 had a widely fluctuating Tb while FFI mouse 2 had a persistently warm Tb.

