
Figure 1.
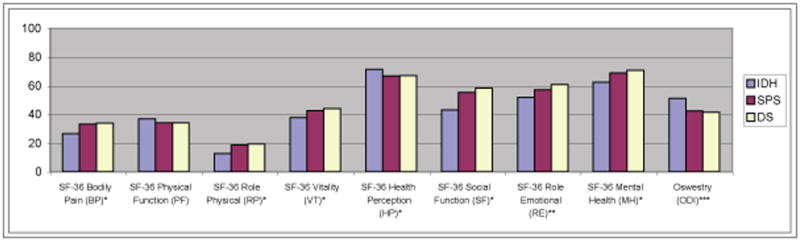
*IDH patients significantly different from SPS and DS (p<0.05)
**IDH patients significantly different from DS and not SPS (p<0.05)
***ODI has reverse scale: 100=disabled, 0=normal, IDH significantly different from SPS and DS (p<0.05)
Official websites use .gov
A
.gov website belongs to an official
government organization in the United States.
Secure .gov websites use HTTPS
A lock (
) or https:// means you've safely
connected to the .gov website. Share sensitive
information only on official, secure websites.
*IDH patients significantly different from SPS and DS (p<0.05)
**IDH patients significantly different from DS and not SPS (p<0.05)
***ODI has reverse scale: 100=disabled, 0=normal, IDH significantly different from SPS and DS (p<0.05)