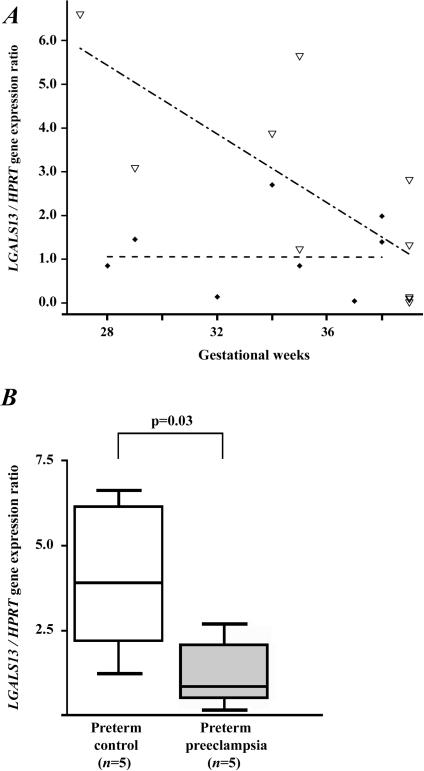
Figure 3. Placental LGALS13 gene expression.
(A) The regression line for the LGALS13 / HPRT gene expression ratio decreased with advancing gestational age in control women (n=10; ▿ – - –), while it did not change in patients with preeclampsia (n=9; ◆ - -). (B) The LGALS13 / HPRT gene expression ratio was 3.5-fold lower in women with preterm preeclampsia than in preterm controls. Boxes represent the median±25th percentiles, whiskers the extreme values.

