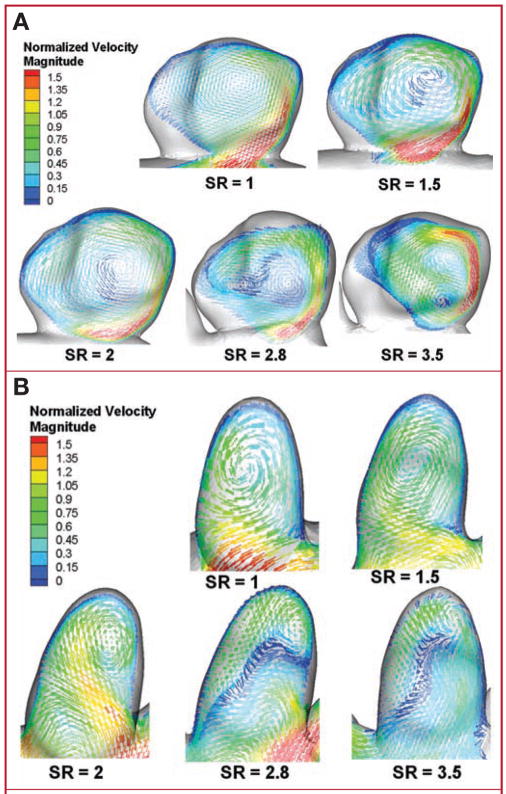
FIGURE 3.
Drawings showing intra- aneurysmal flow patterns (time averaged) from experiment 1 illustrated by vector plots on planes cutting through the aneurysm volume for sidewall IA (A) and terminal (B) IA cases. Velocities are normalized with the corresponding inlet velocity, thereby allowing comparison of A and B. Vector lengths have been held constant to enhance visibility of vortex structures; color scales indicate velocity magnitude. Flow patterns change from a simple, single vortex to multiple vortices when SR is more than 2. Time-dependent animations of the intra-aneurysmal flow over a cardiac cycle have been included as supplemental files (see Videos, Supplementary Digital Content 1, http://links.lww.com/A779, and Supplementary Digital Content 2, http://links.lww.com/A780). Dynamics of the vortices observed can be seen in the animations.

