
Figure 3. The crystal structure of Vta1CTD.
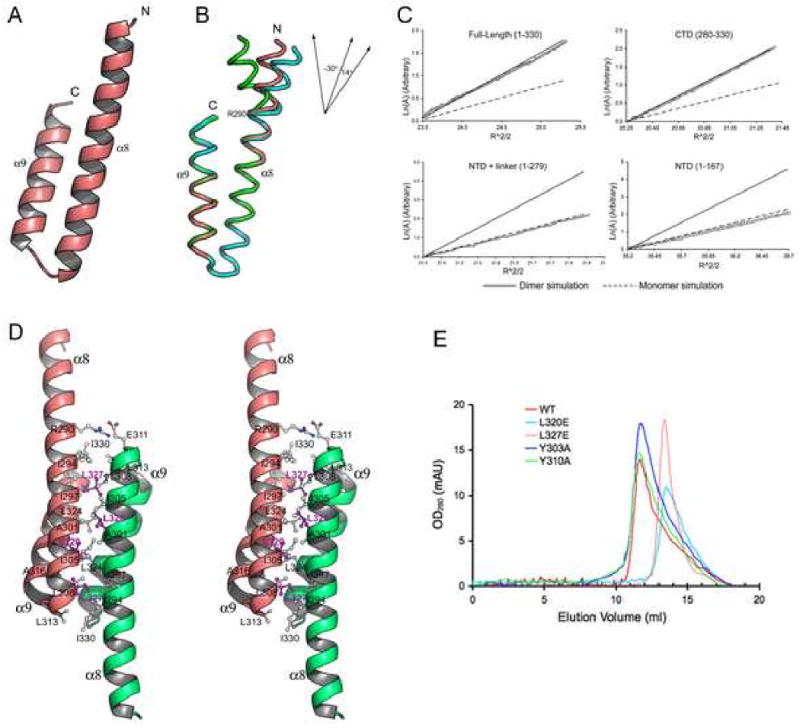
(A) A ribbon representation of the monomer structure of Vta1CTD. The N- and C-termini of the molecule are indicated. (B) Structure flexibility within Vta1CTD. Three Vta1CTD molecules that represent the largest differences among the six molecules in the asymmetric unit are shown as ribbons and colored green, pink, and cyan, respectively. Top right insert: a schematic diagram illustrating different degrees of helix α8 bending at Arg-290. (C) LnA vs R2 plot of sedimentation equilibrium analytical ultracentrifugation data. The slope of the plot is proportional to the molecular weight of the protein. Data is plotted alongside simulations using theoretical values for the molecular weight of a dimer (solid line) or a monomer (dash line) species, with an arbitrary Y-axis for direct comparison. (D) Stereo view of the dimer structure of Vta1CTD. One molecule is colored pink, the other colored green. Residues located at the dimer interface are labeled. Leu-320 and Leu-327 are highlighted in magenta. (E) Gel filtration analysis. Gel filtration experiments were performed on a Supedex™ 200 column (Amersham). Compared with the wild-type protein (red), L320E (cyan) and L327E (pink) eluted at a monomer position; while Y303A (blue) and Y310A (green) maintained their dimeric structures. Figures 2A, 2B and 2D are prepared with Pymol (DeLano Scientific LLC).