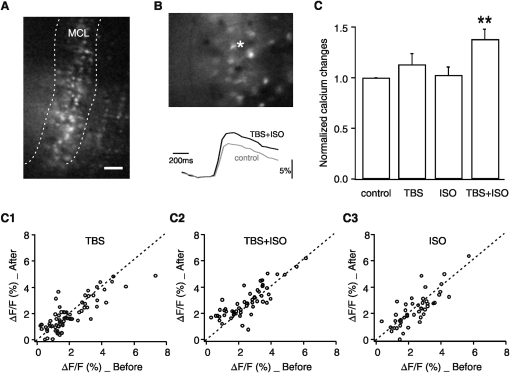
Figure 2.
Pairing of TBS and isoproterenol (ISO) increased MC calcium responses. (A) ΔF/F calcium image (20× objective) of a slice stained with a calcium indicator dye, Oregon Green BAPTA-1 AM. The MC layer is labeled by white dashed lines. Scale bar, 50 μm. (B) An example of ΔF/F calcium imaging showing enhanced calcium responses following TBS+ISO in one MC (white asterisk). Lower traces are calcium transients recorded from the soma of the MC. (C) Averaged calcium transient changes in MCs following TBS, ISO, and TBS+ISO (normalized to control), measured at 30 min post-manipulations. **P < 0.01. (C1) Single-cell calcium transient changes before and after TBS. Dashed black line indicates no change. Cells above the dashed line show increased calcium responses, whereas those below the dashed line show decreased calcium responses. (C2) MC calcium responses to paired TBS and ISO. Note that the majority of MCs showed increased calcium responses following TBS+ISO. (C3) MC calcium responses to ISO only.

