
Figure 6.
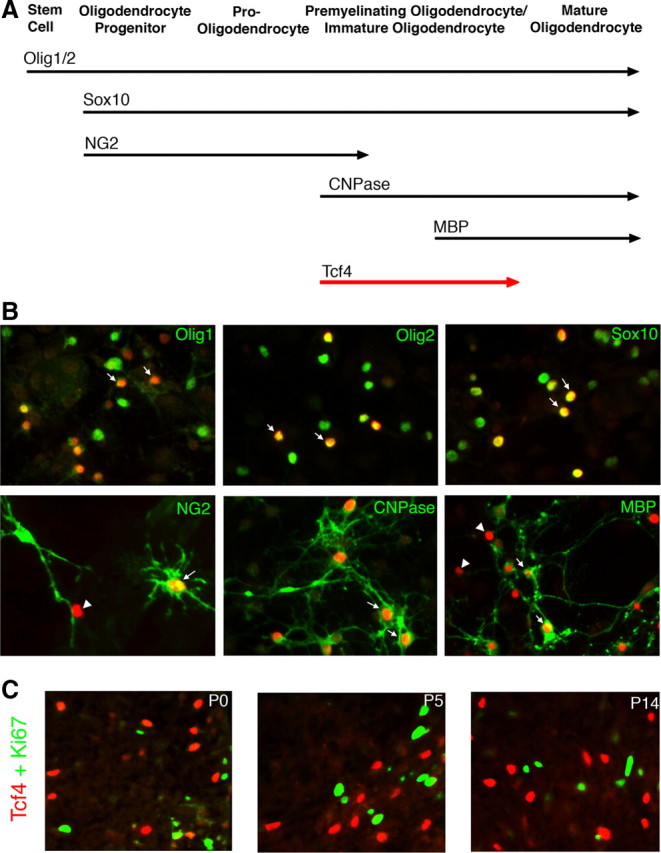
Tcf4 marks postmitotic/premyelinating oligodendrocytes. A, Schematic drawing of stage-specific markers for oligodendrocyte development. B, Double immunofluorescence of Tcf4 (red) with stage-specific markers (green) in mixed glia cultures. Arrows point to the double-labeled cells, and arrowheads point to cells that are only Tcf4+. As expected, Tcf4 is expressed in a subpopulation of Olig1+, Olig2+, and Sox10+ cells because these markers are detectable at all stages of oligodendrocyte formation [36 ± 11% (n = 9), 40 ± 12% (n = 3), and 35 ± 8% (n = 7), respectively]. However, Tcf4 shows a near 90% overlap with CNPase [88 ± 2% (n = 9)] and only partial overlap with NG2 [47 ± 20% (n = 6)] or MBP [36 ± 12% (n = 5)]. C, Double immunofluorescence with antibodies to Tcf4 (red) and Ki67 (green), a marker for dividing cells. As indicated, there is no overlap between Tcf4 and Ki67.