
Fig. 2.
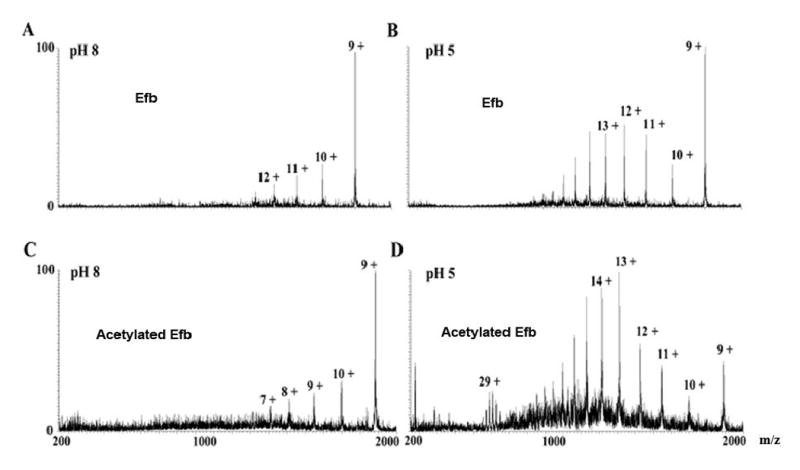
ESI mass spectra of Efb and acetylated Efb recorded at different pH values. A) Efb at pH 8; B) Efb at pH 5; C) acetylated Efb at pH 8, D) acetylated Efb at pH 5. Peaks are labeled according to the corresponding charge states. Note that acetylated Efb displayed the same charge state distribution as native protein at multiple pH values. Similar results were obtained in an ESI charge state distribution analysis of Efb-C (see supplemental figure 1). This suggested that the acetylation reaction itself did not perturb the folding state of Efb(-C).