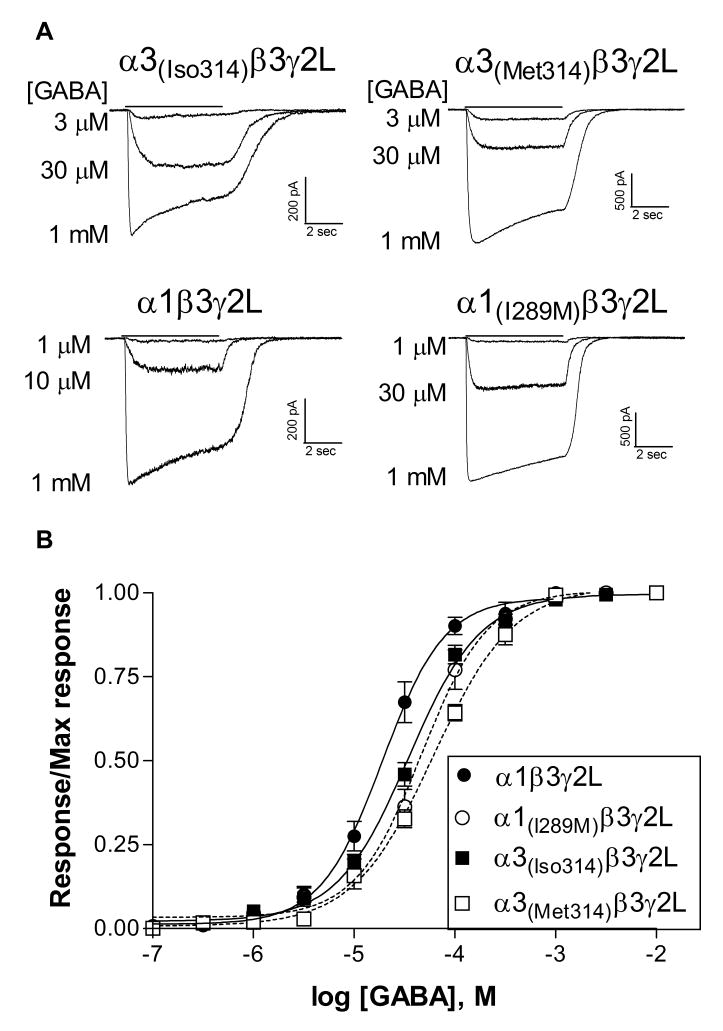
Figure 2. GABA sensitivity.
A. Representative whole-cell current traces from cells transfected with the α subunit indicated in combination with β3 and γ2L. GABA was applied for 5 sec (solid line) to cells voltage clamped at -50 mV.
B. Normalized concentration-response relationships were constructed by dividing the peak response to each concentration of GABA by the maximum current response for each cell. Points represent the mean ± SEM. Data were fit with a four-parameter logistic equation. EC50's of the fits shown to averaged data were 19.1 μM (α1 wild-type, N=5), 47.0 μM (α1(I289M), N=5), 34.7 μM (α3(Iso314), N=6), and 61.3 μM (α1(Met314), N=6).

