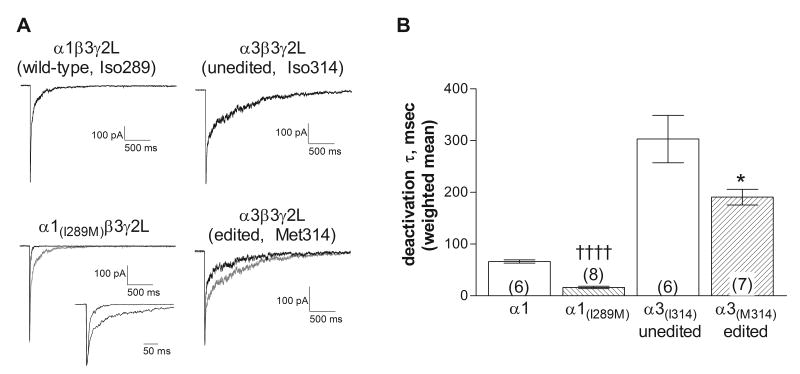
Figure 4. Deactivation rate.
A. Representative macropatch current traces from receptors containing the subunits indicated in response to a 5 ms application of 3 mM GABA. The gray traces show the isoleucine-containing α subunits, scaled to overlay the response of the methionine-containing subunits. Inset shows overlaid traces from α1-containing receptors at an expanded time scale. For the α1-containing receptors, the components for the traces shown had time constants (and relative areas) of 15.2 msec (65.6%) and 152.8 msec for the wild-type subunit and 7.3 msec (83.7%) and 31.3 msec for the α1(I289M). For the α3-containing receptors, the components for the traces shown had time constants (and relative areas) of 30.2 msec (48.0%) and 852.6 msec for the unedited form (Iso314) and 25.3 msec (70.8%) and 558.7 msec for the edited form (Met314). Correlation coefficients for all fits were greater than 0.95.
B. The current deactivation was fit with the sum of two exponential components. Symbols and bars represent the weighted average ± SEM and the number in parentheses indicates number of patches. The average decay rate of the methionine-containing subunits was significantly faster than those with the isoleucine residue for both the α1 and α3 subtypes. †††† (p≤0.0001, compared to α1-wildtype), * (p ≤0.05 compared to α3-isoleucine) using a 2-tailed unpaired t-test.

