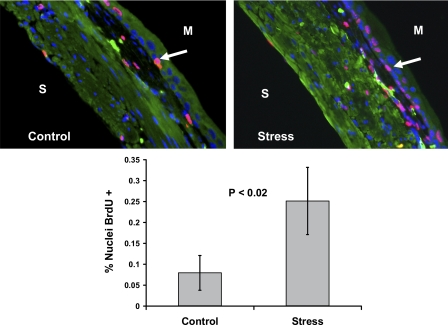
Fig. 7.
Social stress leads to increased DNA synthesis in the bladder wall as measured by BrdU uptake. The values in the graph represent the means ± SD from 5 control and 5 stress mice. Images shown are color merged; therefore, nuclei staining pink are those with BrdU uptake as highlighted by the arrows. Blue nuclei are those in which no BrdU uptake is noted. S, serosal surface; M, mucosal surface.

