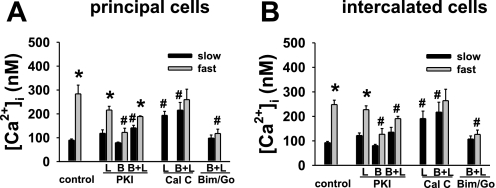
Fig. 8.
Effect of luminal (L) and/or basolateral (B) kinase inhibitors on baseline (black) and peak (gray) [Ca2+]i in CCDs perfused at, respectively, slow and fast flow rates in PC and IC. Values are means ± SE. For each protocol, n is indicated in results. *P < 0.05 compared with slow flow in the same group of tubules. #P < 0.05 vs. control at same flow rate.

