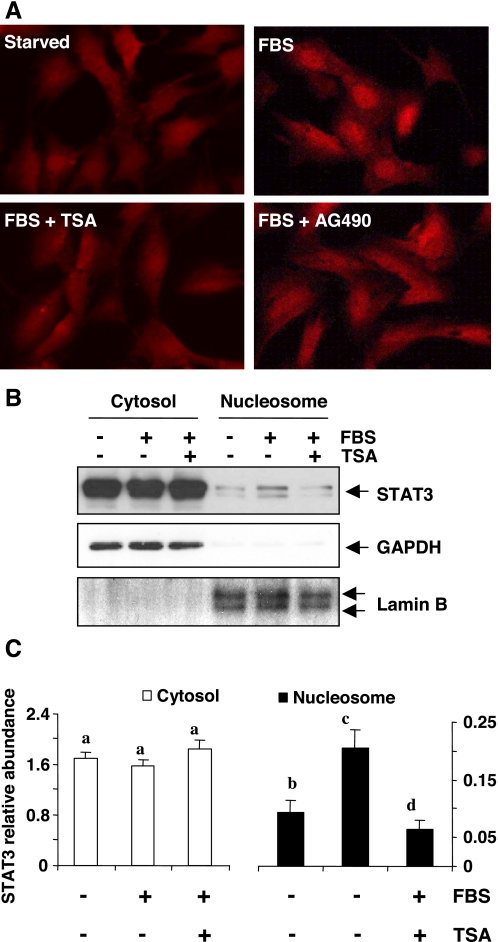
Fig. 3.
Effect of TSA on serum-induced translocation of STAT3. NRK-49F cells were serum-starved for 24 h and then treated with 5% FBS in the presence or absence of 100 nM TSA for 1 h (A) or 30 min (B). A: cells were stained with anti-STAT3 antibody and then subjected to microscopic analysis (×600). B: cytosolic and nuclear proteins were separated and subjected to immunoblot analysis of STAT3, GADPH, or lamin B. C: expression levels of cytosolic and nuclear STAT3 were quantified by densitometry and normalized to GADPH or lamin B levels, respectively. Bars with different letters (a–c) are significantly different from one another (P < 0.05).

