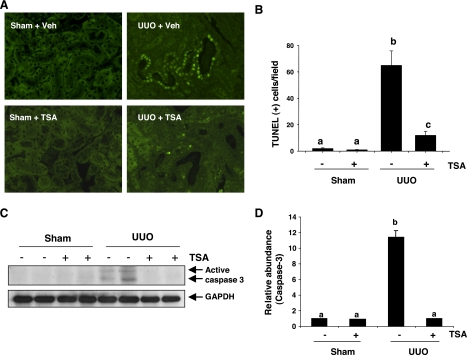
Fig. 8.
Effect of TSA on renal tubular cell apoptosis after UUO injury. A: representative micrographs demonstrating the expression and localization of apoptosis in different groups as indicated (×400). B: the number of apoptotic tubular cells was counted and expressed as means ± SD of 4 animals/group. Bars with different letters (a–c) are significantly different from one another (P < 0.05). C: whole kidney tissue lysates were subjected to immunoblot analysis with antibodies against caspase-3 or GAPDH. D: expression levels of active caspase-3 were quantified by densitometry and are expressed as fold-induction over controls. Values are means ± SD of 3 independent experiments. Bars with different letters (a–d) are significantly different from one another (P < 0.05).

