Figure 6.
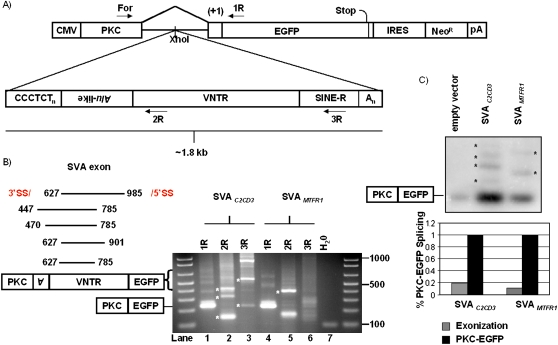
SVA gene-trapping and exonization are not rare. (A) Two SVAs were cloned into PKC-EGFP (Newman et al. 2006) to test the mutagenic potential of SVA splicing. Primers used for RT-PCR are marked. (B) RT-PCR was performed on total RNA extracted from 293T cells transiently transfected with pPKC-EGFP containing one of two different SVAs cloned into the intron. SVA exonization events (left panel) are annotated with the first and last nucleotide of the SVA exon, all of which occur within the Alu-like and VNTR domains. A representative agarose gel displaying SVA alternative splicing events is shown (right panel) (see Table 3). (*) Indicates bands verified by DNA sequencing to be SVA splicing events. (C) Semi-quantitative PCR to determine the frequency of SVA exonization. Ten cycles of PCR on cDNA from individual pPKC-EGFP, pPKC-SVAC2CD3, and pPKC-SVAMTFR1 transfections were carried out using PKC For and 1R. PCR products were resolved on a 2% agarose gel, followed by overnight transfer to a membrane, and subsequent probing using a DNA probe targeting the PKC exon (top panel). (*) Indicates bands quantified by a phosphorimager. Total SVA exonization was normalized to PKC-EGFP splicing within each respective lane and graphed (bottom panel).

