

Abstract
Live-cell imaging allows detailed dynamic cellular phenotyping for cell biology and, in combination with small molecule or drug libraries, for high-content screening. Fully automated analysis of live cell movies has been hampered by the lack of computational approaches that allow tracking and recognition of individual cell fates over time in a precise manner. Here, we present a fully automated approach to analyze time-lapse movies of dividing cells. Our method dynamically categorizes cells into seven phases of the cell cycle and five aberrant morphological phenotypes over time. It reliably tracks cells and their progeny and can thus measure the length of mitotic phases and detect cause and effect if mitosis goes awry. We applied our computational scheme to annotate mitotic phenotypes induced by RNAi gene knockdown of CKAP5 (also known as ch-TOG) or by treatment with the drug nocodazole. Our approach can be readily applied to comparable assays aiming at uncovering the dynamic cause of cell division phenotypes.
High-content image-based screening is a powerful technology for gene function studies or drug profiling. This technology is characterized by the combination of automated microscopy to rapidly acquire high-content images of treated cells and sophisticated computational methods to extract quantitative information in an automatic and unbiased way.
Quantitative studies have been performed based on populations of cells to analyze high-throughput RNAi (Wheeler et al. 2004; Neumann et al. 2006; Goshima et al. 2007), protein overexpression (Harada et al. 2005), or drug profiling screens (Perlman et al. 2004; Loo et al. 2007). Such studies require methods for segmentation and feature extraction, and classification if different object classes are considered. Publicly available software platforms like CellProfiler (Carpenter et al. 2006) can be applied. For population-based studies, however, results are often limited to general features of entire cell populations at certain time points.
By contrast, following single cells over time allows studying the inherent dynamics of cellular and molecular processes more accurately and is consequently widely used in state-of-the-art cell biology. To make time-lapse imaging of single cells applicable for high content screening, additional methods for tracking of cells throughout image sequences and recognition of their phenotypic changes are required. Tracking approaches have been used, e.g., to quantify the level of fluorescently tagged proteins over time (e.g., Sigal et al. 2006; Gordon et al. 2007) or to quantify cell–cell interactions and cell migration dynamics (e.g., Chen et al. 2009). Automated classification methods have also been used on static images to distinguish different phenotype classes, providing information on the structure and location of subcellular phenotypes at a single cell level (e.g., Conrad et al. 2004; Huang and Murphy 2004; Chen et al. 2007; Hamilton et al. 2007).
Combining classification and tracking methods to study the temporal behavior of different cell classes at a single cell level enables a detailed analysis of the kinetics of a phenotype and allows putting different phenotypes in a causative order. This is ideal for many dynamic biological processes such as, the cell cycle. Automatic determination of cell cycle phases has been performed using phase-contrast (Yang et al. 2005; Li et al. 2008) and fluorescence (Chen et al. 2006; Wang et al. 2007, 2008; Padfield et al. 2009) microscopy image sequences. There, cells were classified into a maximum of four phases based on two-dimensional (2D) multicell images. However, none of these previous studies determined cell cycle phase lengths and abnormal morphologies, which are required for fully automated annotation of aberrant mitotic phenotypes.
Here, we have overcome this limitation and present a fully automatic approach to determine morphological and temporal phenotypes by accurately computing and analyzing the lengths of normal and, if present, abnormal mitotic phases and their temporal correlation. Our approach is based on three-dimensional (3D) multicell confocal microscopy image sequences of unsynchronized cell populations expressing fluorescent markers of chromosomes. To analyze these images, we introduce an approach that is based on a multislice 2D strategy and consists of the following main steps: Segmentation and tracking of chromosome sets, extraction of static and dynamic image features, classification, phase length determination and parsing the cell division cycle by a finite state machine.
We validated our approach on two sets of proof-of-principle experiments. First, we characterized the detailed cell division behavior of a human cell line (HeLa) with fluorescently marked chromosomes. Then, we compared this behavior to cells where mitosis was perturbed with low doses of the spindle poison nocodazole or by RNAi depletion of CKAP5 (also known as ch-TOG), a microtubule-associated protein (MAP) involved in spindle organization in diverse organisms (Gard and Kirschner 1987; Cullen et al. 1999). Our approach performed with comparable accuracy as very time-consuming manual annotation and allowed quantitative and detailed statistical analysis of the effects of drug or siRNA perturbations on cell division. In addition, we successfully applied our approach to images of a different cell line (NRK, normal rat kidney) and from a different screening platform. Thus, our approach is applicable to fully automated analysis of cell division in movies from living cells and can be applied on a large scale or adapted to other biological processes.
Results
Automated determination of mitotic phase lengths and phenotypes
We developed an approach for automatically quantifying the mitotic phase lengths, which consists of five major steps: (1) segmentation of chromosome sets, (2) tracking, (3) extraction of features, (4) classification, and (5) phase length determination, including cell cycle parsing (Fig. 1A).
Figure 1.

Phase length determination. (A) Image analysis workflow. Steps from top to bottom: (1) maximum intensity projection resulting in 2D image sequences, (2) segmentation and tracking, (3) determination of 2D regions-of-interest in the projected images and 3D regions-of-interest in the original 3D images, (4) computation of image features on the projected images for 2D regions-of-interest, computation of image features on the most informative slices for 3D regions-of-interest, (5) combination of both feature sets, (6) classification to determine the mitotic phases, (7) consistency check and phase length determination for resulting phase sequences. (B) Tracking result for several dividing cell nuclei (left) and for a nucleus that divides into three daughter nuclei (right). (C) Sample images to illustrate the considered 12 classes, including seven normal cell cycle phases (black), four morphological phenotype classes, and a cell death class (red). n is the total number of processed samples per class. (D) Finite state machine (FSM) to check and correct phase sequences. The phases are modeled by the states of the FSM, the possible phase transitions are represented by the state relations. If an illegal phase transition occurs, the FSM passes into the respective error state. For clarity not all relations of the error states E1–E12 are displayed.
To show the efficiency of our approach, we developed a live-cell imaging assay for controlled perturbation of microtubules using nocodazole. Alternatively, we used RNAi depletion of the MAP CKAP5 to perturb microtubules. In prometaphase, all chromosomes must be attached, bi-oriented, and congressed into an equatorial metaphase plate by spindle microtubules. When microtubules were perturbed by either assay we expected chromosome congression defects resulting in a delay or even arrest in a prometaphase-like state (Musacchio and Salmon 2007) (for simplicity and because of similar morphology, this state was labeled as prometaphase). If these defects persisted beyond prometaphase, chromosomal abnormalities occurred: lagging chromosomes and segregation defects during anaphase, appearance of micronuclei with diverse shapes, sizes, and intensities during late anaphase, as well as telophase, and multinucleated and/or abnormally shaped, nonspheroidal interphase nuclei (Fig. 1C). For both assays 3D image sequences were acquired on a confocal laser scanning microscope with a time lapse of 7 min and three optical sections per time step.
In the first step of our approach, we applied maximum intensity projection (MIP) at each time step of the 3D image sequences and performed segmentation of the projected images by a region-adaptive thresholding approach suited to handle morphologically abnormal chromosome sets (Supplemental Fig. S1; for details, see Methods). Our segmentation approach reached an accuracy of 98.1% (based on four image sequences including 14,596 chromosome sets; Supplemental Table S1). Next, chromosome sets were tracked by exploiting the smoothness of trajectories to determine correspondences. To detect mitotic events and connect the trajectories of mother and daughter cells we used different morphological, as well as intensity-based properties. Divisions into two daughters, as well as abnormal divisions into more than two, could be accurately detected (Fig. 1B). Our scheme was able to determine 99.8% of the correspondences correctly and thereby tracked 95.4% of occurring mitoses correctly (208 of 218, determined in 22 image sequences from five independent experiments with different treatments; Supplemental Table S2). For each chromosome set we computed many static features, such as shape and texture, as well as dynamic features computed as differences of static features e.g., mean intensity and object size over time. Shape-related features were computed based on the projected images, while texture-related features were computed based on the most informative image slice. A support vector machine (SVM) classifier was used to classify the chromosome sets automatically into 12 classes: seven normal cell division cycle phases (interphase and the six mitotic phases: prophase, prometaphase, metaphase, early anaphase, late anaphase, and telophase), four abnormal phases (abnormal interphase, abnormal early and abnormal late anaphase, and abnormal telophase), and one cell death class (apoptosis) (Fig. 1C; Supplemental Fig. S2). To determine the classification accuracy we manually annotated 16 time-lapse sequences from the nocodazole and four sequences from the RNAi experiments, which served as ground truth (Supplemental Table S3). Using fivefold cross validation we achieved an overall classification accuracy of 93.9% for the nocodazole data (Table 1) and 94.7% for the RNAi data (Supplemental Table S4). Finally, we trained one SVM classifier with the annotated nocodazole data and another SVM classifier with the annotated RNAi data, and applied each of the classifiers to previously unseen test data consisting of 20 sequences for nocodazole and eight sequences for RNAi experiments, respectively.
Table 1.
Confusion matrix for fivefold cross validation on the training set

aInterphase samples were reduced to 1000 samples per sequence.
bAnaphase 1 and Anaphase 2 denote early anaphase and late anaphase, respectively.
cAbnormal morphology classes. The relatively low accuracies for the classes “abnormal early anaphase” and “abnormal late anaphase” are due to the very low number of available samples in conjunction with a high intraclass variability.
To measure the mitotic phase lengths based on the classification results we introduce a finite state machine which represents the syntax of the cell cycle. The finite state machine models the progression of mitotic phases (Fig. 1D), checks the consistency of phase sequences, corrects illegal phase transitions, and, at the same time, determines individual cell cycle phase lengths. Using this approach the length of each phase was measured for all cells throughout the processed image sequences (Fig. 2; Supplemental Fig. S3).
Figure 2.

Automatically computed phase lengths. (A) Phase length histograms for automatically annotated data. X-axis, phase length (min); y-axis, relative frequency. Histograms are displayed for a maximum length of 140 min (20 time steps). (B) Mean phase lengths (min.) for the automatically annotated data for all treatments and controls. The shaded regions indicate the standard deviations.
Automatically determined prometaphase length as a sensitive readout of drug and RNAi perturbation of mitosis
To prove that our automatic system is able to determine changes of mitotic progression accurately, we analyzed the effect of perturbations of the assembly of the mitotic spindle on the length of mitotic phases with particular attention to prometaphase. Our automated quantitative analysis allowed us to test whether prometaphase in perturbed cells was significantly longer than in controls, as well as to determine the dose response of three different nocodazole concentrations (low, medium, and high).
Our automatic comparison of the prometaphase length distributions of nocodazole treated and control cells revealed a highly significant prometaphase prolongation for all nocodazole concentrations (Table 2A). A nocodazole concentration of 12 nM (high) showed a stronger prolongation (∼127 ± 26 min) of higher significance (P = 4.2 × 10⁻¹², Mann-Whitney U test) compared to 10 nM and 8 nM (medium and low), respectively. The medium concentration produced more cases of strong delay than the low concentration, showing a dose response, but the low concentration datasets gave a higher proportion of delayed cells. Regarding prometaphase duration however, medium and low concentration of nocodazole were not significantly different. The automatic analysis and statistical evaluation furthermore showed that cells treated with CKAP5 siRNA had an even more dramatic increase of prometaphase duration of ∼218 ± 25 min (P = 2.3 × 10⁻¹², Mann-Whitney U test) compared to control cells treated with scrambled (scr) siRNA (Table 2A). This analysis can be summarized in a compact manner by plotting the mean cell division phase lengths on a biological time axis according to the normal sequence of mitotic phases (Fig. 2B). This plot reveals at one glance that the perturbations are specific to prometaphase and that the increasing strengths of the phenotypes are caused by rising doses of nocodazole and CKAP5 RNAi. These results agree very well with the manually annotated data as we found no significant differences between the distributions of manually and automatically annotated data (Fig. 3B,C; Supplemental Table S5).
Table 2.
Results for statistical tests

n1, n2, and n are the sample numbers.
Figure 3.

Prometaphase prolongation for different treatments. (A) Sample image sequences with the automatic annotation result for the three different nocodazole experiments (for the same images of the RNAi-depletion experiment, see Supplemental Fig. S5). The first occurrence of morphological aberrations is marked for each image sequence by a red arrow. (B) Cumulative histogram of prometaphase length for all concentrations of the automatically (manually) annotated nocodazole experiments. (C) Cumulative histogram for the automatically (manually) annotated scr control and CKAP5 RNAi experiments. (Solid lines) Automated annotation; (dashed lines) manual annotation. The prometaphase length is given in minutes.
Automatic temporal correlation of early and late mitotic phenotypes
To test whether prometaphase delays were linked with chromosome segregation and nuclear shape abnormalities in later stages of mitosis, we performed a temporal correlation analysis. First, we determined the percentage of prolonged prometaphases in the different spindle perturbation experiments (Supplemental Fig. S4). As a threshold for normal prometaphase length we used the mean plus twice the standard deviation of prometaphase duration in the control cells (mean ∼ 15 ± 11 min; Supplemental Table S6). To calculate the probability of the occurrence of chromosome segregation problems after prometaphase, we divided the number of time steps with abnormal morphologies occurring after prometaphase by the total number of time steps after prometaphase for each dividing cell. This analysis showed that prolonged prometaphases, caused by chromosome congression and alignment defects, resulted in a higher number of aberrant late mitotic phenotypes, which was reflected by a higher probability compared to normal prometaphases (Supplemental Table S7).
Next, we determined Spearman's correlation coefficient between prometaphase length and late phenotype probability. We obtained highly significant values of ρ = 0.38 for the automatically annotated nocodazole data, and ρ = 0.57 for the automatically annotated RNAi data, respectively, consistent with the manual annotation (Table 2B). This temporal correlation of different phenotypes shows quantitatively and with statistical significance that even mild perturbations of the spindle that result in transient prometaphase delays cause chromosome segregation defects and thus allows us to put different events in a causal order in time. (For more details on the statistical analysis results, see Supplemental Results.)
Application to images of different cells and from a different screening platform
To demonstrate the applicability of our approach for different experimental settings we further analyzed images of a different cell line and images acquired with a different microscopy screening platform.
In a first study, we used a different cell line, namely NRK cells, which were imaged using the same screening platform (LSM 510 point-scanning microscope) as for the previously analyzed HeLa cells (Supplemental Fig. S9). We applied our image analysis approach to six image sequences of nontreated NRK cells including about 4000 chromosome sets. Our approach could be directly applied without changing any parameter value except for the maximum displacement. Since NRK cells have a higher motility than HeLa cells, for tracking we increased the parameter value for the maximum displacement. Our evaluation showed that we yielded high accuracies for segmentation (99.3%) and tracking (99.7% correspondence finding, 87.5% mitosis detection) (Supplemental Tables S16, S17). For classification we obtained an overall accuracy of 92.9% using fivefold cross validation on all six image sequences (ground truth was generated by manual annotation; Supplemental Table S18). Finally, we determined the cell cycle phase durations based on the automatically classified chromosome sets (Supplemental Fig. S10).
In a second study, we used a different microscopy screening platform, namely the LSM 5 LIVE line-scanning microscope with a charged coupled device, which allows faster image acquisition, but provides half of the resolution in the x–y direction compared to the LSM 510 Meta point-scanning microscope with a photomultiplier. We acquired image sequences of nontreated HeLa cells (see Methods, Live-cell Imaging) and applied our approach to four image sequences including about 9100 chromosome sets. To analyze the images from the different platform (LSM 5 LIVE, line-scanning microscope) we only changed a few parameter values (maximum displacement, window size, minimum nucleus size, and maximum fragment distance), which were straightforwardly obtained by linearly scaling the values according to the change in resolution. From the evaluation, we found that we yielded accuracies of 99.8% for segmentation and 99.9% for tracking (using ground truth from manual evaluation, Supplemental Tables S19, S20), and 97.8% for classification (using fivefold cross validation based on manually annotated ground truth; Supplemental Table S21). Again, we successfully determined the cell phase durations automatically for all sequences (Supplemental Fig. S11).
Experimental comparison with other segmentation and tracking approaches
We also performed a quantitative experimental comparison of our segmentation and tracking approaches with other approaches (based on four image sequences [control, low, medium, and high concentrations] of HeLa cells including 14,596 chromosome sets).
For segmentation we applied two other often used approaches for cell nucleus segmentation, namely global Otsu thresholding and K-means clustering (using three clusters, which is the optimal setting for the considered data), which are included in the public domain software ImageJ (http://rsb.info.nih.gov/ij/). We used the same preprocessing (i.e., Gaussian filtering) and post-processing (i.e., hole-filling) steps as for our approach. From the evaluation study we found that global Otsu thresholding yielded an accuracy of 68.9% and K-means clustering an accuracy of 73.9%, while our approach resulted in 98.1%. One main reason why our approach yields a significantly better result is that we cope with the issue of merging detached chromosomes. In contrast, global Otsu thresholding and K-means clustering lead to a relatively high number of oversegmentations, as can be seen from Supplemental Table S22.
For tracking we used the cell tracking algorithm provided in CellProfiler (Carpenter et al. 2006), as well as the often used ImageJ plugin MTrack2 (http://valelab.ucsf.edu/∼nico/IJplugins/MTrack2.html). As input for tracking we used the segmentation results from our segmentation approach. Note that both tracking algorithms cannot handle splitting events. From the analysis it turned out that for CellProfiler, as well as for MTrack2, the percentage of correct correspondences was slightly lower than the result for our approach (99.6% vs. 99.8%). More importantly, the two approaches cannot handle splitting events, while a main advantage of our approach is the detection of mitosis events and the tracking of cell divisions.
Discussion
We developed a fully automated image analysis approach to quantify the temporal evolution of morphological phenotypes from time-lapse sequences of living cells. We applied our method for the analysis of cell division under normal and perturbed conditions. While we obtained high overall classification accuracies of 93.9% and 94.7%, the accuracy for the morphologically abnormal phenotypes was generally lower than for the morphologically normal cells. Reasons for this are the high variability within abnormal classes together with the low sample number for abnormal morphologies. Also, the differences to normal morphologies can often be subtle, and slightly abnormal phenotypes may be misclassified as normal. However, by increasing the number of training samples these accuracies could be further increased.
In comparison to recent work (Chen et al. 2006; Wang et al. 2007), our approach allows classification of chromosome sets into normal and abnormal mitotic phases induced by spindle perturbations. Our image analysis methods are adapted to capture abnormal morphologies, for example, by segmentation of detached chromosomes together with the main chromosome set, or by detection of abnormal mitotic events, like, e.g., cell divisions into multiple daughter chromosome sets. Furthermore, our scheme automatically performs per-cell measurements of cell cycle phase durations and thus allows detection of even subtle kinetic delays during mitosis that do not cause morphological aberrations. This detailed single cell kinetic analysis allows automatic and quantitative annotation of the development of aberrant phenotypes during the cell cycle.
An important feature of single cell kinetic analysis is that correlations between subsequent events can be tested statistically and events can therefore be put into a causal order. For example, the automatically analyzed nocodazole data showed a significant positive correlation between the prolongation of prometaphase and the incidence of subsequent chromosome segregation defects in the daughter cells. Incomplete chromosome attachments caused by a perturbed mitotic spindle were expected to trigger the spindle checkpoint, causing delays or arrests in prometaphase (Musacchio and Salmon 2007). However, the relatively low concentrations of nocodazole we used allowed cells to eventually enter anaphase. Interestingly, this often occurred without congression of every chromosome to a tight and normal metaphase plate, indicating the ability of HeLa cells to bypass the spindle checkpoint after prometaphase delays. This premature mitotic exit induced many chromosome segregation errors resulting in multinucleated daughter cells. Our method automatically provided a direct and quantifiable link between these early and late mitotic phenotypes.
Our image analysis approach was applied to a large amount of image data of more than 140,000 cell images in different phases of the cell cycle. After training of the classifier to recognize the desired morphological classes no manual interactions or adaptations were necessary throughout the analysis process. Our approach can therefore, in principle, be applied for high-throughput analysis of large-scale screening data of libraries of drug or RNAi perturbations if adequate training ensures that all encountered morphologies can be classified with sufficient accuracy. The image analysis workflow presented here is composed of fast algorithms to allow high-speed processing of large data sets. In addition, our software can be run on computer clusters allowing a highly parallelized processing of large-scale data.
We also showed that our approach can be readily applied to images acquired under different experimental settings. Using images of a different cell line and images acquired on a different microscopy platform we found that our approach yielded comparably high accuracies. However, we note that our approach, in particular, the segmentation approach is adapted and optimized for fluorescence microscopy images of cell nuclei. Thus, for analyzing images from a very different type of microscope (e.g., phase contrast microscope) it might be advantageous to plug in a better adapted segmentation approach. Moreover, with our approach it is possible to include additional analysis steps into the workflow if necessary. For example, to deal with spatial positioning issues that may occur in live-cell imaging, a registration step can be included into the analysis pipeline, as we have done in one of our earlier studies (Kim et al. 2007).
In conclusion, we report for the first time an automated image analysis approach that provides a quantitative profile of single cell cycle progression and phenotypes. We show that the extracted data can be mined statistically to search for the underlying causes of temporal and morphological phenotypes. Due to the flexibility of our approach it can also be used to analyze other time-resolved cellular and subcellular changes in different experimental settings.
Methods
Live-cell imaging
To image chromosome dynamics during the cell cycle, HeLa (Kyoto) cells stably expressing core histone 2B tagged with enhanced green fluorescent protein (H2B-EGFP) (Hirota et al. 2004) were cultured in #1 LabTek chambers (Nalge Nunc) and imaged at 37°C on the microscope stage. Images were acquired with customized LSM 510 Meta or LSM 5 LIVE confocal microscopes using a 63× Plan-Apochromat 1.4 N.A. oil objective (Carl Zeiss) for the LSM 510 Meta, and a 40× Plan-Neofluar 1.3 N.A. oil objective for the LSM 5 LIVE. Multiposition 4D imaging with autofocus was implemented as described (Rabut and Ellenberg 2004). Typical stacks of 1024 × 1024 pixels × 3 slices were acquired for up to 21 h (xyzt resolution: 0.14 × 0.14 × 3.0 μm × 7 min) on the LSM 510 Meta, and stacks of 512 × 512 pixels × 5 slices (xyzt resolution: 0.33 × 0.33 × 2.5 μm × 5 min) on the LSM 5 LIVE. Phototoxicity and photobleaching were stringently minimized as described (Mora-Bermúdez and Ellenberg 2007). Cell density was optimized to provide the largest number of cells per field, while minimizing confluency in the culture at the end of each experiment (2–4 d after plating, in nocodazole and RNAi, respectively).
Generation of segregation defects with nocodazole and RNAi
To test the accuracy of our methodology we used two types of assays. First we developed a pharmacological assay using defined doses of the standard microtubule-depolymerizing drug nocodazole (Calbiochem). Prewarmed solutions were rapidly, but gently, added to the cell culture medium on the microscope stage between the first and second rounds of image acquisition. The final concentrations were 8 (low), 10 (medium), or 12 (high) nM, or the equivalent of solvent (DMSO) in controls. Second, to validate our methodology for RNAi assays, we used an established RNAi protocol (Hirota et al. 2004) to deplete the microtubule-associated protein CKAP5. The high incidence of mitotic and nuclear structure defects confirmed the efficiency of both types of perturbation.
Image analysis workflow
To analyze the acquired image data, we developed an automatic image analysis approach based on a complex workflow (Fig. 1A). To optimize processing speed, the workflow was designed to perform most image analysis operations in 2D using a multislice strategy. Therefore, segmentation and tracking were performed on maximum intensity projection (MIP) images generated at each time step. Image features were computed based on the projected images and based on the most informative image slice for each cell nucleus. After classification, the resulting phase sequences were checked for consistency, and mitotic phase lengths were determined using a finite state machine.
Segmentation of chromosome sets
Cell segmentation and tracking are essential steps for biological image analysis, and thus have been used in various applications. Recent methods for cell and cell nucleus segmentation in the context of large scale image analysis are based on certain assumptions, e.g., that cells are roughly blob-shaped or that the morphology does not change significantly (e.g., Fenistein et al. 2008; Chen et al. 2009). However, since in our application we are facing very diverse and strongly changing morphologies, we cannot make such assumptions about the morphology of the objects, and thus rely primarily on the image histogram, which is largely independent of object morphologies.
For segmentation we developed a region-adaptive thresholding approach based on Otsu's method (Otsu 1979) to determine local thresholds. Prior to segmentation we smoothed the images with a Gaussian filter (σ = 2.5). For region-adaptive thresholding a quadratic sliding window (9 × 9 pixels) was used. The automatic computation of the local thresholds was performed in a larger region around the sliding window with an edge length of approximately the width of an average interphase nucleus (81 × 81 pixels). Using such overlapping regions significantly improved the segmentation result in comparison to using nonoverlapping regions. A local threshold was only computed if the variance within the region was higher than a defined threshold. Else, the global Otsu threshold (computed for the whole image) was used. This strategy significantly reduced the computation time since local threshold computations were only performed in image regions including fluorescent objects. The approach produced satisfying results for chromosome sets with normal morphology. However, for accurate segmentation of abnormal morphologies an extension was necessary. For example, dim micronuclei attached to a bright normal nucleus were only partially segmented since the automatically determined local threshold was affected by the bright nucleus. To improve the result we used the incomplete segmentation result as a mask for the images and automatically set the masked pixels to a lower intensity value based on the mean value of the whole image. Region-adaptive thresholding was performed again on the masked images, and the results from the first and second runs were combined to determine the final segmentation. Finally, hole-filling was performed. To merge single detached chromosomes to their corresponding chromosome set we included a post-processing step by which small objects were connected to chromosome sets in their close neighborhood. To this end, a line was inserted connecting the centers of gravity of both segmented objects (Supplemental Fig. S1). The size threshold for small objects to be connected was chosen significantly below the average size of a late anaphase nucleus, which is the smallest occurring regular chromosome set (minimum nucleus size 2000 pixels). The neighborhood was defined by a maximum Euclidean distance between the centers of gravity of the segmented objects (maximum fragment distance) of 85 pixels (or 11.9 μm).
We evaluated the accuracy of our segmentation scheme based on manually determined ground truth. To this end, we used four image sequences (by randomly picking one for each nocodazole concentration and one control). We quantified the occurrence of undersegmentations (cosegmentation of neighboring objects as one object) and oversegmentations (decomposition of one object into multiple objects) for all chromosome sets at all time points. It turned out that we obtained an overall accuracy of 98.1%, where the segmentation errors of 1.9% were due to 3/4 undersegmentations and 1/4 oversegmentations (Supplemental Table S1).
Tracking of chromosome sets
Due to the strong temporal changes of the object morphologies in our application, our tracking approach cannot rely on morphological features for correspondence finding as in previous work on cell tracking (e.g., Chen et al. 2009). Moreover, the algorithm has to deal with splitting objects as cells divide. Active contour-based methods are well-suited for tracking highly deformable cells and can also handle cell divisions (e.g., Dufour et al. 2005). However, the computation time for active contours is typically relatively high and a requirement is that an overlap of the tracked contours in consecutive image frames exists. This, however, is often not the case in our application, particularly not when cells divide. Thus, for tracking dividing cells we developed a two-step approach. First, initial trajectories are determined using a feature point tracking algorithm (Chetverikov and Verestoy 1998) where the centers of gravity of the segmented chromosome sets are used as feature points. For each frame of an image sequence this algorithm considers the predecessor and successor frame and establishes object correspondences by searching for trajectories with maximum smoothness within a defined Euclidean distance. In the second step, mitotic events are detected to connect the respective trajectories. Here, only chromosome sets without a predecessor that are located within a limited Euclidean distance to the potential parent are considered. The decision for a mitosis event is based on two criteria: (1) both potential daughter chromosome sets have to be smaller than the average size of a nucleus (computed for the whole sequence) multiplied by a factor of c1 and (2) the Euclidean distance between the potential daughter cells has to be smaller than the average nucleus radius multiplied by a factor of c2 (in our case we used c1 = 0.6 and c2 = 3.2). If (1) and (2) are fulfilled, a measure for the likelihood of a mitosis event Lm is computed.
The mitosis likelihood measure can be written as
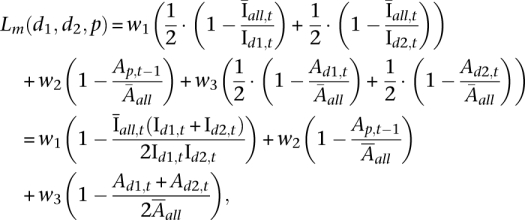 , ,
|
where d1, d2 represent the daughter chromosome sets at time step t, and p the parent cell nucleus at time step t − 1, Id1,t and Id2,t are the mean intensities of d1 and d2, Ad1,t and Ad2,t are the areas (i.e., number of pixels) of d1 and d2,  is the mean intensity of all chromosome sets at time step t, and
  is the mean area of all chromosome sets in the whole sequence. Each term yields a maximum value of 1, and the three terms are weighted by w1, w2, w3 (with w1 + w2 + w3 = 1). In our application we used values of w1 = 0.5, w2 = 0.2, w3 = 0.3 which were empirically determined. To find suitable values for c1, c2, and w1, w2, w3, we tested a wide range of parameter values using a large number of images. We validated the values for c1 and c2 considering feature distributions over the whole population of ground truth data (Supplemental Note 1).
If Lm is sufficiently high, the respective case is considered as a mitotic event and the corresponding tracks are connected. Note that the number of daughter cells corresponding to a parent cell is not restricted to two and thus also abnormal divisions into more than two daughter cells can be tracked (Fig. 1B).
The tracking accuracy was determined based on the same four sequences as already used to determine the segmentation accuracy (Supplemental Table S2). We found that for a total number of about 16,900 matches, 40 mismatches occurred, yielding an overall accuracy of 99.8%. Twenty-nine of the 40 mismatches were caused by segmentation errors, nine by mitosis detection errors, and only two were actual tracking errors. Thus, the error of the correspondence finding is very low (0.01%). The mitosis detection accuracy was determined based on 22 sequences with three sequences for each nocodazole concentration, six sequences for the nocodazole controls, and four sequences for the RNAi experiments. Our mitosis detection scheme yielded an overall accuracy of 95.4% and a positive predictive value of 92.0%. Here, the 18 observed false-positives were caused by abnormal morphologies such as detaching micronuclei.
Feature extraction
Features for cell image classification have been studied for many years, in particular, for classification of subcellular structures (e.g., Boland et al. 1998; Boland and Murphy 2001; Conrad et al. 2004; Huang and Murphy 2004). In Boland and Murphy (2001) a standard feature set for subcellular location characterization was introduced and extended to a large set of 2D and 3D image features (Huang and Murphy 2004). Also in other fields of microscopy image classification, a wide range of image features has been studied (e.g., Ronneberger et al. 2002; Lindblad et al. 2003; Rodenacker and Bengtsson 2003; Pincus et al. 2007). A general overview of commonly used image feature types is given, e.g., Theodoridis and Koutroumbas (1999).
Here, we used a feature set that is an extension of a previously used feature set (Conrad et al. 2004). Features for each cell nucleus were computed based on the MIP images and based on single image slices of the original 3D images. In the latter case, we selected for each nucleus the most informative slice based on maximum total intensity. The reason for using the original image slices for feature extraction is that fine textures, which are important for the classification of certain phases (e.g., prophase), can be blurred in the projected images. On the other hand, the projected images were also required because the selected slice did not necessarily contain the entire object, e.g., detached chromosomes often were located in other slices. Consequently, to exploit the maximum possible information we computed features related to texture, like Haralick texture, granularity, grayscale invariants, or wavelet features based on the most informative slices, and features primarily related to object shape, e.g., size, circularity, Feret's diameter, contour length, or Zernike moments based on the projected images (Supplemental Table S9; Supplemental Note 2). Our choice of using a combined feature set that includes features based on the projected, as well as the most informative slice, was supported by experimental comparison of classification accuracies for the different feature sets. Supplemental Table S10 shows relatively similar results for each alternative, but the combined feature set yielded slightly higher overall and average classification accuracies, and yields the best result for most of the classes, which indicates an advantage of this method.
In addition to these static features we used dynamic features representing the temporal morphological changes of chromosome sets. These features were computed as differences of six basic features (i.e., object size, mean intensity, standard deviation of intensity, circularity, minimum and maximum diameters) in the current frame to its predecessor and its successor frame based on the tracking result. In total 376 features were extracted and used for automated classification.
Automatic classification of chromosome sets
To automatically classify chromosome sets into 12 classes (interphase, prophase, prometaphase, metaphase, early anaphase, late anaphase, telophase, abnormal early and late anaphase, abnormal telophase, abnormal interphase, and cell death) (Fig. 1C; Supplemental Fig. S2), we applied support vector machines (SVMs) (Vapnik 1998) with a Gaussian radial basis function (RBF) kernel. The multiclass classification problem was solved with a one-against-one approach (C Chang and C-J Lin, http://www.csie.ntu.edu.tw/∼cjlin/libsvm). For k classes this method constructs k(k − 1)/2 binary classifiers and trains each classifier for two classes. To optimize the penalty parameter C and the kernel parameter γ, we performed threefold cross validation with varying parameters on the training set (model selection) prior to the actual training of the classifier.
We performed classification experiments using the original feature set and reduced feature sets. For feature reduction we applied principal component analysis (PCA) using different numbers of principal components and compared the results with the result using all original features. It turned out that for the reduced feature sets of 5, 10, 20, 30, 50, and 100 principal components, we obtained lower classification accuracies than for the original feature set (Supplemental Fig. S7). For 50 and 100 principal components we obtained classification accuracies of 92.6% and 92.3%, respectively, in comparison to 94.0% for the original feature set. Additionally, we performed experiments using independent component analysis (ICA). Fifty and 100 independent components resulted in very similar results as for PCA (92.4% and 92.3%, respectively). Therefore, we used the original feature set for classification in this work. Note that the experiments for feature reduction were performed using a combined classifier trained with data from both the nocodazole and the RNAi experiments. We found that the combined classifier performed similar to the separate classifiers (Supplemental Table S11).
To obtain a more balanced data set and reduce the computation time for the training of the classifier we limited the number of interphase samples to 1000 per sequence. This strategy yielded better results than using weighted support vector machines (Supplemental Note 3).
Consistency check and error correction
To ensure the consistency of the resulting phase sequences and to determine the phase lengths we developed a finite state machine (FSM), which models the cell cycle and accepts only biologically plausible phase sequences. Valid phases are represented by states of the FSM and possible phase transitions by state relations. Additionally, the FSM includes error states for all regular states that handle illegal phase transitions by correction or resetting (Fig. 1D; for clarity only the most important relations are displayed).
The FSM processes phase sequences sequentially and the first phase defines the start state. While the input phases stick to allowed phase transitions the FSM changes into the respective states and at each state the number of occurring phases is counted. If an illegal phase transition occurs, the FSM takes the corresponding error state. As soon as the error state is left, the erroneous phases are corrected retrospectively depending on the current state. If the error state cannot be left after two time steps, the FSM resets the current state to the respective state of the last input phase to avoid being stuck in the error state. After processing of the whole sequence, a corrected list of phases with all phase durations is returned.
We quantified the improvement in accuracy obtained by the error correction step. To this end, we trained a classifier based on 12 sequences of the nocodazole ground truth data set and used the remaining four nocodazole sequences for testing (the test sequences included one sequence for each treatment concentration and one control sequence). We applied the FSM twice on the classification result for the test sequences and compared the result to the true classes and to the classification result before FSM processing. It turned out that the overall classification accuracy of 80.2% improved to 81.0% using the FSM. We note, however, that the primary goal of the error correction step is not to improve the overall accuracy, but to recover the consistency of the determined phase sequence. A consistent phase sequence is particularly important for the subsequent statistical analysis of the cell cycle phase durations. This can be illustrated by an example. Assume a sequence of 100 classification results covering several cell cycle phases of a cell, and suppose that all classifications are correct except one error in the middle of a certain phase. Correcting this single error improves the overall classification accuracy by only 1%, however, the accuracy for quantifying the phase length for the considered phase is improved by 50% (the reason is that since the error occurs in the middle of the phase and therefore the consistency is broken, we obtain for the phase length a value that is half of the correct length). Using our automatic approach all inconsistencies have been corrected (up to a certain length). However, not all inconsistencies have been corrected in agreement with the ground truth data, since partially there are multiple possibilities for correction.
After applying the FSM we post-processed the corrected phase sequences to combine phases that were split by longer errors and caused a resetting of the FSM. In addition, biologically implausible multiple alternations between interphase and abnormal interphase were combined into one phase. In essence, this post-processing step yields an improved phase sequence to derive the most biologically plausible sequence.
Implementation
Our software was developed on a Linux platform and the algorithms for segmentation, tracking, feature extraction, as well as phase sequence parsing were implemented in C/C++. The software is freely available at http://www.bioquant.uni-hd.de/bmcv/genomeresearch. For SVM classification we used the publicly available C++ library LIBSVM (http://www.csie.ntu.edu.tw/∼cjlin/libsvm). The average computation time for one image with 512 × 512 pixels and about 20 cells per image was 1.9 sec for segmentation (including preprocessing and post-processing), 1.1 sec for tracking, 15.0 sec for feature extraction (384 features per cell), 0.6 sec for classification, and <0.1 sec for phase sequence parsing (using an AMD Opteron processor with 2.2–2.4 GHz). Note that for feature extraction the computation time can be significantly reduced by hardware acceleration using graphics processing units (GPUs), e.g., in our recent work in Gipp et al. 2008 an acceleration of a factor of about 30 was achieved.
Statistical analysis
To check whether the extracted phase lengths were normally distributed we performed Shapiro-Wilk tests for all experiments (Supplemental Table S8). Since for almost all of the experiments a normal distribution could not be assumed we used nonparametric statistics, in particular, the Mann-Whitney U test for not paired data to test whether significant shifts between phase length distributions existed (Table 2A; Supplemental Table S5).
To compute correlation coefficients we used nonparametric statistics, in particular Spearman's ρ. To ensure that the determined correlations did not occur due to a random effect, we performed significance tests with the alternative hypothesis: “True ρ is greater than zero” (Table 2B). For all statistical tests we used a significance level of α = 5%.
Acknowledgments
This work was supported by the EU projects MitoCheck and EuroDyna. R.E. and J.E. acknowledge funding within the MitoCheck consortium by the European Commission (FP6-503464), as well as by the Federal Ministry of Education and Research (BMBF) in the framework of the National Genome Research Network (NGFN) (NGFN-2 SMP-RNAi, FKZ01GR0406, and FKZ01GR0403) and the German Research Council (DFG EI 358/3-1/2 and DFG EL 246/2-1/2) within the EuroDYNA European Science Foundation network (ESF 03-DYNA-F-29).
Footnotes
[Supplemental material is available online at http://www.genome.org.]
Article published online before print. Article and publication date are at http://www.genome.org/cgi/doi/10.1101/gr.092494.109.
References
- Boland MV, Murphy RF. A neural network classifier capable of recognizing the patterns of all major subcellular structures in fluorescence microscope images of HeLa cells. Bioinformatics. 2001;17:1213–1223. doi: 10.1093/bioinformatics/17.12.1213. [DOI] [PubMed] [Google Scholar]
- Boland MV, Markey MK, Murphy RF. Automated recognition of patterns characteristic of subcellular structures in fluorescence microscopy images. Cytometry. 1998;33:366–375. [PubMed] [Google Scholar]
- Carpenter AE, Jones TR, Lamprecht MR, Clarke C, Kang IH, Friman O, Guertin DA, Chang JH, Lindquist RA, Moffat J, et al. CellProfiler: Image analysis software for identifying and quantifying cell phenotypes. Genome Biol. 2006;7:R100. doi: 10.1186/gb-2006-7-10-r100. [DOI] [PMC free article] [PubMed] [Google Scholar]
- Chen X, Zhou X, Wong S. Automated segmentation, classification, and tracking of cancer cell nuclei in time-lapse microscopy. IEEE Trans Biomed Eng. 2006;53:762–766. doi: 10.1109/TBME.2006.870201. [DOI] [PubMed] [Google Scholar]
- Chen S, Zhao T, Gordon G, Murphy R. Automated image analysis of protein localization in budding yeast. Bioinformatics. 2007;23:i66–i71. doi: 10.1093/bioinformatics/btm206. [DOI] [PubMed] [Google Scholar]
- Chen Y, Ladi E, Herzmark P, Robey E, Roysam B. Automated 5-D analysis of cell migration and interaction in the thymic cortex from time-lapse sequences of 3-D multi-channel multi-photon images. J Immunol Methods. 2009;340:65–80. doi: 10.1016/j.jim.2008.09.024. [DOI] [PMC free article] [PubMed] [Google Scholar]
- Chetverikov D, Verestoy J. Proceedings of the 14th International Conference Pattern Recognition. Vol. 2. IEEE Computer Society; Washington, DC: 1998. Tracking feature points: a new algorithm; pp. 1436–1438. [Google Scholar]
- Conrad C, Erfle H, Warnat P, Daigle N, Lörch T, Ellenberg J, Pepperkok R, Eils R. Automatic identification of subcellular phenotypes on human cell arrays. Genome Res. 2004;14:1130–1136. doi: 10.1101/gr.2383804. [DOI] [PMC free article] [PubMed] [Google Scholar]
- Cullen CF, Deák P, Glover DM, Ohkura H. mini spindles: A gene encoding a conserved microtubule-associated protein required for the integrity of the mitotic spindle in Drosophila. J Cell Biol. 1999;146:1005–1018. doi: 10.1083/jcb.146.5.1005. [DOI] [PMC free article] [PubMed] [Google Scholar]
- Dufour A, Shinin V, Tajbakhsh S, Guillen-Aghion N, Olivo-Marin J-C, Zimmer C. Segmenting and tracking fluorescent cells in dynamic 3-D microscopy with coupled active surfaces. IEEE Trans Image Process. 2005;14:1396–1410. doi: 10.1109/tip.2005.852790. [DOI] [PubMed] [Google Scholar]
- Fenistein D, Lenseigne B, Christophe T, Brodin P, Genovesio A. A fast, fully automated cell segmentation algorithm for high-throughput and high-content screening. Cytometry A. 2008;73:958–964. doi: 10.1002/cyto.a.20627. [DOI] [PubMed] [Google Scholar]
- Gard DL, Kirschner MW. A microtubule-associated protein from Xenopus eggs that specifically promotes assembly at the plus-end. J Cell Biol. 1987;105:2203–2215. doi: 10.1083/jcb.105.5.2203. [DOI] [PMC free article] [PubMed] [Google Scholar]
- Gipp M, Marcus G, Harder N, Suratanee A, Rohr K, König R, Männer R. Proceedings of the World Congress on Engineering 2008 (WCE'08), The 2008 International Conference of Parallel and Distributed Computing (ICPDC'08) Newswood Limited, International Association of Engineers; London, UK: 2008. Accelerating the computation of Haralick's Texture Features using Graphics Processing Units (GPUs) pp. 587–593. [Google Scholar]
- Gordon A, Colman-Lerner A, Chin T, Benjamin K, Yu R, Brent R. Single-cell quantification of molecules and rates using open-source microscope-based cytometry. Nat Methods. 2007;4:175–181. doi: 10.1038/nmeth1008. [DOI] [PubMed] [Google Scholar]
- Goshima G, Wollman R, Goodwin S, Zhang N, Scholey J, Vale R, Stuurman N. Genes required for mitotic spindle assembly in Drosophila S2 cells. Science. 2007;316:417–421. doi: 10.1126/science.1141314. [DOI] [PMC free article] [PubMed] [Google Scholar]
- Hamilton N, Pantelic R, Hanson K, Teasdale R. Fast automated cell phenotype image classification. BMC Bioinformatics. 2007;8:110. doi: 10.1186/1471-2105-8-110. [DOI] [PMC free article] [PubMed] [Google Scholar]
- Harada J, Bower K, Orth A, Callaway S, Nelson C, Laris C, Hogenesch J, Vogt P, Chanda S. Identification of novel mammalian growth regulatory factors by genome-scale quantitative image analysis. Genome Res. 2005;15:1136–1144. doi: 10.1101/gr.3889305. [DOI] [PMC free article] [PubMed] [Google Scholar]
- Hirota T, Gerlich D, Koch B, Ellenberg J, Peters JM. Distinct functions of condensin I and II in mitotic chromosome assembly. J Cell Sci. 2004;117:6435–6445. doi: 10.1242/jcs.01604. [DOI] [PubMed] [Google Scholar]
- Huang K, Murphy R. Boosting accuracy of automated classification of fluorescence microscope images for location proteomics. BMC Bioinformatics. 2004;5:78. doi: 10.1186/1471-2105-5-78. [DOI] [PMC free article] [PubMed] [Google Scholar]
- Kim I-H, Godinez WJ, Harder N, Mora-Bermúdez F, Ellenberg J, Eils R, Rohr K. Proceedings of the SPIE International Symposium on Medical Imaging 2007—Image Processing (MI'07) SPIE; Bellingham, WA: 2007. Compensation of global movement for improved tracking of cells in time-lapse confocal microscopy image sequences. [Google Scholar]
- Li K, Miller ED, Chen M, Kanade T, Weiss LE, Campbell PG. Cell population tracking and lineage construction with spatiotemporal context. Med Image Anal. 2008;12:546–566. doi: 10.1016/j.media.2008.06.001. [DOI] [PMC free article] [PubMed] [Google Scholar]
- Lindblad J, Wählby C, Bengtsson E, Zaltsman A. Image analysis for automatic segmentation of cytoplasms and classification of Rac1 activation. Cytometry A. 2003;57:22–33. doi: 10.1002/cyto.a.10107. [DOI] [PubMed] [Google Scholar]
- Loo L-H, Wu L, Altschuler S. Image-based multivariate profiling of drug responses. Nat Methods. 2007;4:445–453. doi: 10.1038/nmeth1032. [DOI] [PubMed] [Google Scholar]
- Mora-Bermúdez F, Ellenberg J. Measuring structural dynamics of chromosomes in living cells by fluorescence microscopy. Methods. 2007;41:158–167. doi: 10.1016/j.ymeth.2006.07.035. [DOI] [PubMed] [Google Scholar]
- Musacchio A, Salmon ED. The spindle-assembly checkpoint in space and time. Nat Rev Mol Cell Biol. 2007;8:379–393. doi: 10.1038/nrm2163. [DOI] [PubMed] [Google Scholar]
- Neumann B, Held M, Liebel U, Erfle H, Rogers P, Pepperkok R, Ellenberg J. High-throughput RNAi screening by time-lapse imaging of live human cells. Nat Methods. 2006;3:385–390. doi: 10.1038/nmeth876. [DOI] [PubMed] [Google Scholar]
- Otsu N. A threshold selection method from grey level histograms. IEEE Trans Syst Man Cybern. 1979;9:62–66. [Google Scholar]
- Padfield D, Rittscher J, Thomas N, Roysam B. Spatio-temporal cell cycle phase analysis using level sets and fast marching methods. Med Image Anal. 2009;13:143–155. doi: 10.1016/j.media.2008.06.018. [DOI] [PubMed] [Google Scholar]
- Perlman Z, Slack M, Feng Y, Mitchison T, Wu L, Altschuler S. Multidimensional drug profiling by automated microscopy. Science. 2004;306:1194–1198. doi: 10.1126/science.1100709. [DOI] [PubMed] [Google Scholar]
- Pincus Z, Theriot JA. Comparison of quantitative methods for cell-shape analysis. J Microsc. 2007;227:140–156. doi: 10.1111/j.1365-2818.2007.01799.x. [DOI] [PubMed] [Google Scholar]
- Rabut G, Ellenberg J. Automatic real-time three-dimensional cell tracking by fluorescence microscopy. J Microsc. 2004;216:131–137. doi: 10.1111/j.0022-2720.2004.01404.x. [DOI] [PubMed] [Google Scholar]
- Rodenacker K, Bengtsson E. A feature set for cytometry on digitized microscopic images. Anal Cell Pathol. 2003;25:1–36. doi: 10.1155/2003/548678. [DOI] [PMC free article] [PubMed] [Google Scholar]
- Ronneberger O, Schultz E, Burkhardt H. Automated pollen recognition using 3D volume images from fluorescence microscopy. Aerobiologia. 2002;18:107–115. [Google Scholar]
- Sigal A, Milo R, Cohen A, Geva-Zatorsky N, Klein Y, Alaluf I, Swerdlin N, Perzov N, Danon T, Liron Y, et al. Dynamic proteomics in individual human cells uncovers widespread cell-cycle dependence of nuclear proteins. Nat Methods. 2006;3:525–531. doi: 10.1038/nmeth892. [DOI] [PubMed] [Google Scholar]
- Theodoridis S, Koutroumbas K. Pattern recognition. Academic; New York: 1999. [Google Scholar]
- Vapnik V. Statistical learning theory. Wiley; New York: 1998. [Google Scholar]
- Wang M, Zhou X, King R, Wong S. Context based mixture model for cell phase identification in automated fluorescence microscopy. BMC Bioinformatics. 2007;8:32. doi: 10.1186/1471-2105-8-32. [DOI] [PMC free article] [PubMed] [Google Scholar]
- Wang M, Zhou X, Li F, Huckins J, King R, Wong S. Novel cell segmentation and online SVM for cell cycle phase identification in automated microscopy. Bioinformatics. 2008;24:94–101. doi: 10.1093/bioinformatics/btm530. [DOI] [PubMed] [Google Scholar]
- Wheeler D, Bailey S, Guertin D, Carpenter A, Higgins C, Sabatini D. RNAi living-cell microarrays for loss-of-function screens in Drosophila melanogaster cells. Nat Methods. 2004;1:127–132. doi: 10.1038/nmeth711. [DOI] [PubMed] [Google Scholar]
- Yang F, Mackey M, Ianzini F, Gallardo G, Sonka M. Springer; New York: 2005. Cell segmentation, tracking, and mitosis detection using temporal context. Proceedings of MICCAI'05, Vol. 3749 of LNCS; pp. 302–309. [DOI] [PubMed] [Google Scholar]