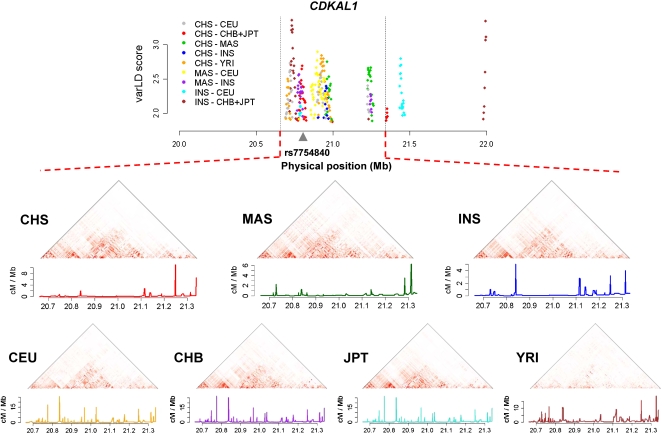
Figure 4.
LD variation and population-specific recombination rates at CDKAL1. The extent of LD variation between pairs of SGVP and HapMap populations at the CDKAL1 gene, with separate LD heatmaps and recombination rates estimated from genotype data at each population. Population-specific recombination rates are shown except for CHB and JPT, where the same HapMap estimated recombination rates for JPT+CHB are used.

